List of U.S. states by carbon dioxide emissions
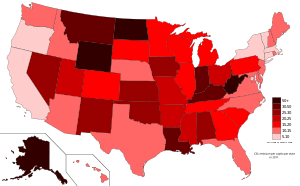
CO2 emission per capita per year per state (2011 data).
This is a list of U.S. states by carbon dioxide emissions due to human activity. The data presented below from the US Environmental Protection Agency and the US Energy Information Administration corresponds to emissions in 2014.[1] Interactive bar charts (showing state rankings for total and per-capita emissions) and interactive maps (for both total emissions and per capita emissions) for the 2014 data are available on Tableau Public.
Table
| Rank | Jurisdiction | Annual CO2 emissions (in millions of metric tons)[2] |
Percentage of total emissions |
Population (population estimate in 2014)[3] |
Percentage of total population |
CO2 emissions per capita (in metric tons) |
|---|---|---|---|---|---|---|
| - | States Total | 5,434 | 100.00% | 318,857,056 | 100.00% | 17.04 |
| 1 | Texas | 709 | 13.04% | 26,956,958 | 8.45% | 26.29 |
| 2 | California | 359 | 6.61% | 38,802,500 | 12.17% | 9.26 |
| 3 | Pennsylvania | 242 | 4.46% | 12,787,209 | 4.01% | 18.94 |
| 4 | Illinois | 233 | 4.29% | 12,880,580 | 4.04% | 18.12 |
| 5 | Ohio | 229 | 4.21% | 11,594,163 | 3.64% | 19.75 |
| 6 | Florida | 227 | 4.18% | 19,893,297 | 6.24% | 11.41 |
| 7 | Louisiana | 207 | 3.81% | 4,649,676 | 1.46% | 44.50 |
| 8 | Indiana | 203 | 3.74% | 6,596,855 | 2.07% | 30.81 |
| 9 | New York | 170 | 3.13% | 19,746,227 | 6.19% | 8.61 |
| 10 | Michigan | 162 | 2.97% | 9,909,877 | 3.11% | 16.31 |
| 11 | Georgia | 139 | 2.56% | 10,097,343 | 3.17% | 13.76 |
| 12 | Kentucky | 138 | 2.53% | 4,413,457 | 1.38% | 31.19 |
| 13 | Missouri | 131 | 2.42% | 6,063,589 | 1.90% | 21.66 |
| 14 | North Carolina | 126 | 2.31% | 9.943.964 | 3.12% | 12.64 |
| 15 | Alabama | 121 | 2.24% | 4,849,377 | 1.52% | 25.05 |
| 16 | New Jersey | 114 | 2.10% | 8,938,175 | 2.80% | 12.78 |
| 17 | Oklahoma | 104 | 1.92% | 3,878,051 | 1.22% | 26.92 |
| 18 | Virginia | 103 | 1.90% | 8,326,289 | 2.61% | 12.42 |
| 19 | Tennessee | 103 | 1.89% | 6,549,352 | 2.05% | 15.69 |
| 20 | Wisconsin | 101 | 1.85% | 5,757,564 | 1.81% | 17.47 |
| 21 | West Virginia | 97 | 1.79% | 1,850,326 | 0.58% | 52.47 |
| 22 | Minnesota | 94 | 1.73% | 5,457,173 | 1.71% | 17.24 |
| 23 | Arizona | 93 | 1.71% | 6,731,484 | 2.11% | 13.79 |
| 24 | Colorado | 91 | 1.67% | 5,355,866 | 1.68% | 16.95 |
| 25 | Iowa | 83 | 1.53% | 3,107,126 | 0.97% | 26.78 |
| 26 | South Carolina | 74 | 1.37% | 4,832,482 | 1.52% | 15.39 |
| 27 | Washington | 73 | 1.35% | 7,061,530 | 2.21% | 10.40 |
| 28 | Kansas | 70 | 1.28% | 2,904,021 | 0.91% | 23.97 |
| 29 | Arkansas | 69 | 1.26% | 2,966,369 | 0.93% | 23.13 |
| 30 | Wyoming | 65 | 1.20% | 584,153 | 0.18% | 111.55 |
| 31 | Utah | 64 | 1.19% | 2,942,902 | 0.92% | 21.90 |
| 32 | Massachusetts | 64 | 1.18% | 6,745,408 | 2.12% | 9.49 |
| 33 | Mississippi | 64 | 1.17% | 2,994,079 | 0.94% | 21.28 |
| 34 | Maryland | 62 | 1.14% | 5,976,407 | 1.87% | 10.38 |
| 35 | North Dakota | 55 | 1.02% | 739,482 | 0.23% | 74.81 |
| 36 | Nebraska | 52 | 0.95% | 1,881,503 | 0.59% | 27.51 |
| 37 | New Mexico | 50 | 0.92% | 2,085,572 | 0.65% | 24.07 |
| 38 | Oregon | 38 | 0.70% | 3,970,239 | 1.25% | 9.56 |
| 39 | Nevada | 37 | 0.68% | 2,839,099 | 0.89% | 13.02 |
| 40 | Connecticut | 35 | 0.65% | 3,596,677 | 1.13% | 9.77 |
| 41 | Alaska | 35 | 0.64% | 736,732 | 0.23% | 47.17 |
| 42 | Montana | 32 | 0.59% | 1,023,579 | 0.32% | 31.51 |
| 43 | Hawaii | 18 | 0.33% | 1,419,561 | 0.45% | 12.82 |
| 44 | Maine | 17 | 0.31% | 1,330,089 | 0.42% | 12.52 |
| 45 | Idaho | 17 | 0.31% | 1,634,464 | 0.51% | 10.18 |
| 46 | South Dakota | 15 | 0.28% | 853,175 | 0.27% | 17.91 |
| 47 | New Hampshire | 15 | 0.27% | 1,326,813 | 0.42% | 11.25 |
| 48 | Delaware | 13 | 0.25% | 935,614 | 0.29% | 14.24 |
| 49 | Rhode Island | 11 | 0.20% | 1,055,173 | 0.33% | 10.08 |
| 50 | Vermont | 6 | 0.11% | 626,562 | 0.20% | 9.38 |
| 51 | District of Columbia | 3 | 0.06% | 658,893 | 0.21% | 4.55 |
See also
- Climate change
- Comparisons of life-cycle greenhouse gas emissions
- Global warming
- Greenhouse gas emissions by the United States
- List of countries by carbon dioxide emissions
- List of countries by greenhouse gas emissions
- List of countries by carbon dioxide emissions per capita
- List of countries by greenhouse gas emissions per capita
- List of countries by ratio of GDP to carbon dioxide emissions
Notes
- The 'States Total' value represents the sum of CO2 emissions from the 50 U.S. states plus the District of Columbia. This value differs from total U.S. CO2 emissions from fossil fuel combustion reported in the Inventory of U.S. Greenhouse Gas Emissions and Sinks. The U.S. inventory value is larger because it includes emissions from U.S. territories and protectorates; it also uses a different approach for estimating emissions from non-energy uses of fossil fuels (which are not included in the combustion-related values shown in this table).
- Nationally, CO2 emissions from fossil fuel combustion represented the largest source (76%) of total GWP–weighted emissions from all emission sources in 2014.[1] Similarly, CO2 emissions from fossil fuel combustion are the largest source of greenhouse gas emissions within a state.[1]
References
- 1 2 3 "U.S. Greenhouse Gas Inventory Report: 1990-2014". US Environmental Protection Agency. Retrieved 14 September 2016.
- ↑ "State Energy CO2 Emissions". US Environmental Protection Agency. Retrieved 14 September 2016.
- ↑ "Population Estimates: State Totals: Vintage 2014". Census.gov. US Census Bureau. Retrieved 13 September 2016.
External links
- EPA website
- Energy CO2 Emissions by State
- Interactive graphs and maps of the 2014 data on Tableau Public
- An interactive visualization of the CO2 emissions for each state based on this data
| Demographics | |
|---|---|
| Economy | |
| Environment | |
| Geography | |
| Government | |
| Health | |
| History | |
| Law | |
| Miscellaneous | |
| |
This article is issued from Wikipedia - version of the 11/19/2016. The text is available under the Creative Commons Attribution/Share Alike but additional terms may apply for the media files.