Wind power in Indiana
Wind power in Indiana was limited to a few small water-pumping windmills on farms until 2008 with construction of Indiana's first utility-scale wind power facility, Goodland (phase I) with a nameplate capacity of 130 MW. As of January 2016, Indiana had a total of 1895 MW of wind power capacity installed, ranking it 12th among U.S. states.[1]
The main utility-scale development up to 2016 has been in the northwest part of the state in Benton, White, and Jasper Counties. Fowler Ridge phase III should be completed later in 2010, to give a final nameplate capacity of 750 MW, making Fowler Ridge the Midwest's largest wind farm, and one of the largest in the world. Phases II-VI at Meadow Lake, when complete, will make Meadow Lake even larger at 1000 MW.[2]
Installed capacity and wind resources
The following table compares the growth in wind power installed nameplate capacity in MW for Indiana and the entire United States since 2003.[3]
|
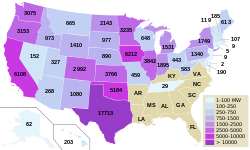 Installed capacity by state as of 2013 (animated map of installed capacity growth) |
 Average annual wind power density map for Indiana at 50m above ground | ||||||||||||||||||||||||||||||||||||
The National Renewable Energy Laboratory estimates that Indiana has the potential to install up to 148 GW of onshore wind power nameplate capacity, generating 443 TWh annually.[4][5] For comparison, Indiana consumed 106.549 TWh of electricity in 2005;[6] while the entire U.S. wind power industry generated approximately 50 TWh in 2008; and Three Gorges Dam (the world's largest electricity-generating station) produced an average of 80 TWh/yr in 2008 and 2009.
Indiana also has some offshore wind resources in the shallows of Lake Michigan along its shoreline.[7][8][9] However, offshore wind power development is far behind onshore development in the United States generally, because onshore development is cheaper and the United States has an abundance of suitable onshore sites to develop. Indiana has no offshore wind farms as of 2016.
Wind generation
Indiana wind generation by month.
 |
| Indiana Wind Generation (GWh, Million kWh) | |||||||||||||
|---|---|---|---|---|---|---|---|---|---|---|---|---|---|
| Year | Total | Jan | Feb | Mar | Apr | May | Jun | Jul | Aug | Sept | Oct | Nov | Dec |
| 2012 | 3,163 | 416 | 307 | 374 | 386 | 212 | 185 | 113 | 94 | 162 | 324 | 234 | 357 |
| 2013 | 3,481 | 450 | 276 | 334 | 396 | 303 | 184 | 138 | 92 | 155 | 297 | 449 | 405 |
| 2014 | 3,495 | 415 | 252 | 323 | 388 | 304 | 190 | 167 | 101 | 158 | 325 | 507 | 366 |
| 2015 | 4,516 | 411 | 413 | 424 | 425 | 365 | 272 | 176 | 165 | 214 | 517 | 554 | 580 |
Wind farms
The following table of wind farms and utility-scale wind power developments uses data from the AWEA,[3] the State of Indiana,[14] and other sources. For the larger projects constructed in phases, the table lists separate information for each phase. The name of each wind farm is the name used by the energy company when referring to the farm. The Wind Farm suffix is implied and hence removed for brevity. For more details and references for each wind farm, see its article.
| Wind farm | County(s) | Turbine model | Power per turbine (MW) | No. of Turbines | Total Nameplate Capacity (MW) | Online | Developer | Operator | Power purchaser | Coordinates |
|---|---|---|---|---|---|---|---|---|---|---|
| Benton County phase I | Benton | GE sl/sle Gen4 | 1.5 | 87 | 130.5 | 2008-04 | Orion Energy | Orion Energy | Duke, Vectren | 40°41′10″N 87°24′29″W / 40.686°N 87.408°W |
| Fowler Ridge phase I Vestas | Benton | Vestas V82 | 1.65 | 182 | 300.3 | 2009-04 | BP, Dominion | BP, Dominion | AEP, Dominion | 40°36′29″N 87°19′12″W / 40.608°N 87.320°W |
| Fowler Ridge phase I Clipper | Benton | Clipper 2.5 | 2.5 | 40 | 100 | 2009-04 | BP, Dominion | BP, Dominion | AEP, Dominion | 40°36′29″N 87°19′12″W / 40.608°N 87.320°W |
| Fowler Ridge phase II | Benton | GE sl/sle Gen4 | 1.5 | 133 | 199.5 | 2009-12 | BP, Dominion | BP, Dominion | AEP, Vectren | 40°36′29″N 87°19′12″W / 40.608°N 87.320°W |
| Headwaters | Randolph | Vestas V110 | 2 | 100 | 200 | December 2014 | EDP Renewables North America | Indiana Michigan Power | ||
| Hoosier | Benton | REpower | 2 | 53 | 106 | 2009-08 | IPL, enXco | IPL, enXco | IPL | 40°36′N 87°19′W / 40.6°N 87.32°W |
| Meadow Lake phase I | White | Vestas V82 | 1.65 | 121 | 199.65 | October 2009 | Horizon Wind Energy | EDP Renewables North America | AEP, wholesale market | 40°36′04″N 86°51′54″W / 40.601°N 86.865°W |
| Meadow Lake phase II | White | Acciona | 1.5 | 66 | 99 | June 2010 | Horizon Wind Energy | EDP Renewables North America | 40°36′04″N 86°51′54″W / 40.601°N 86.865°W | |
| Meadow Lake phase III | White | GE | 1.5 | 69 | 103.5 | October 2010 | Horizon Wind Energy | EDP Renewables North America | 40°36′04″N 86°51′54″W / 40.601°N 86.865°W | |
| Meadow Lake phase IV | White | Suzlon | 2.1 | 47 | 98.7 | October 2010 | Horizon Wind Energy | EDP Renewables North America | 40°36′04″N 86°51′54″W / 40.601°N 86.865°W | |
| Prairie Breeze | Tipton | 1.6 | 94 | 150 | Juwi | 40°21′40″N 86°09′07″W / 40.361°N 86.152°W | ||||
| Union City/Randolph Eastern School Corporation | Randolph | Nordic Windpower | 1 | 2 | 2 | 2010-02 | Performance Services | Union City, Randolph Eastern School Corporation | AEP | 40°12′04″N 84°48′54″W / 40.201°N 84.815°W |
| Wildcat phase I | Madison, Tipton | GE | 1.6 | 125 | 200 | 2012-10 | E.ON | E.ON | AEP | 40°21′07″N 85°52′55″W / 40.352°N 85.882°W |
| Wildcat phase II | Grant, Howard | 40-60 | (proposed) | E.ON | 40°28′48″N 85°51′36″W / 40.480°N 85.860°W | |||||
| Wildcat phase III | Tipton | 40-75 | (proposed) | E.ON | ||||||
| Wildcat phase IV | Tipton | (proposed) | E.ON | |||||||
Single-unit turbines
In addition to the above wind farms, single stand-alone units have also been built in five other locations, mostly at schools. Some of these units were placed to test the environment for future wind energy development.[15][16][17]
| Location | County | Owner | Wind speed (m/s) |
Power (Kw) |
|---|---|---|---|---|
| Middletown | Henry | Shenandoah School Corporation | 900 | |
| Carthage | Shelby | 7.7 / 99m | ||
| Haubstadt | Gibson | South Gibson School Corporation | 6.1 / 99m | |
| Kokomo | Howard | Northwestern School Corporation | 7.0 / 99m | |
| LaGrange | LaGrange | 7.0 / 99m | ||
| Upland | Grant | Taylor University |
Environmental impact
According to the USDOE, each 1000 MW of wind power capacity installed in Indiana will annually save 1,684 million gallons of water and eliminate 3.1 million tons of carbon dioxide emissions.[18]
For comparison, Indiana emitted a total of 230,830,000 metric tons of carbon dioxide in 2007.[19][20]
As of March 2010 Indiana lacked a renewable energy standard, unlike several other midwestern states: Ohio, Illinois, Michigan, Minnesota, Missouri and Iowa.[21] Nevertheless, Indiana's wind power development had outpaced that of Ohio and Michigan.
See also
| Wikimedia Commons has media related to Wind power in Indiana. |
- Indiana Energy Production
- Index of Indiana-related articles
- List of U.S. states by carbon dioxide emissions
- List of wind farms in the United States
- Outline of Indiana
References
- ↑ Installed Wind Capacity, U.S. Department of Energy, 3 April 2016
- ↑ "Meadow Lake Update" (PDF). Horizon Wind Energy. 2009-07-15. Retrieved 2010-03-16.
- 1 2 "U.S. Wind Energy Projects - Indiana". American Wind Energy Association. 2010-09-30. Retrieved 2011-03-07.
- ↑ "Estimates of Windy Land Area and Wind Energy Potential by State for Areas >= 30% Capacity Factor at 80m" (XLS). National Renewable Energy Laboratory. 2010-02-04. Retrieved 2010-03-13.
- ↑ "Indiana Wind Activities". National Renewable Energy Laboratory. 2010-02-19. Retrieved 2010-03-13.
- ↑ "Electric Power and Renewable Energy in Indiana". USDOE, EERE. 2008-06-25. Retrieved 2010-03-13.
- ↑ Bradley, David (2004-02-06). "A Great Potential: The Great Lakes as a Regional Renewable Energy Source" (PDF). Archived from the original (PDF) on 2009-03-25. Retrieved 2008-10-04.
- ↑ "Great Lakes eyed for offshore wind farms". MSNBC, Associated Press. 2008-10-31. Retrieved 2008-11-14.
- ↑ "Momentum Grows for Great Lakes Offshore Wind". NewEnergyNews. 2008-10-31. Retrieved 2008-11-15.
- ↑ EIA (July 27, 2012). "Electric Power Monthly Table 1.17.A.". United States Department of Energy. Retrieved 2012-08-15.
- ↑ EIA (July 27, 2012). "Electric Power Monthly Table 1.17.B.". United States Department of Energy. Retrieved 2012-08-15.
- ↑ EIA (February 2013). "Electric Power Monthly Table 1.17.A." (PDF). United States Department of Energy. Retrieved 2013-05-24.
- ↑ EIA (February 2016). "Electric Power Monthly Table 1.17.A." (PDF). United States Department of Energy. Retrieved 2016-04-03.
- ↑ "Indiana Office of Energy Development - Wind Power". IN.gov - Official Website of the State of Indiana. Retrieved 2010-03-23.
- ↑ ams.confex.com/ams/pdfpapers/91911.pdf
- ↑ http://www.insideindianabusiness.com/newsitem.asp?ID=39751
- ↑ http://www.taylor.edu/sciencecomplex/about/wind-turbines.shtml
- ↑ Lantz, Eric; Tegen, Suzanne (May 2008). "Economic Benefits, Carbon Dioxide (CO2) Emissions Reductions, and Water Conservation Benefits from 1,000 Megawatts (MW) of New Wind Power in Indiana" (PDF, 503kB). EERE, NREL. Retrieved 2010-03-17.
- ↑ http://www.epa.gov/climatechange/emissions/downloads/CO2FFC_2007.pdf
- ↑ http://www.epa.gov/climatechange/emissions/downloads/CO2FFC_2007.xls
- ↑ Slabaugh, Seth (2010-01-11). "Indiana not promoting wind energy like its neighbors". Retrieved 2010-03-23.
| Wind power by state |
| |
|---|---|---|
| Large wind farms | ||
| Wind power companies | ||