Montcalm County, Michigan
| Montcalm County, Michigan | |
|---|---|
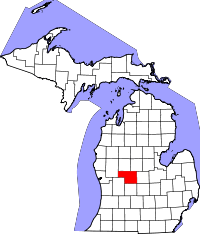 Location in the U.S. state of Michigan | |
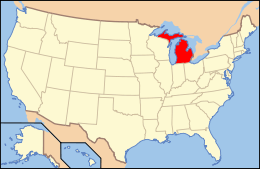 Michigan's location in the U.S. | |
| Founded |
1738 (created) 1850 (organized)[1] |
| Named for | Louis-Joseph de Montcalm |
| Seat | Stanton |
| Largest city | Greenville |
| Area | |
| • Total | 721 sq mi (1,867 km2) |
| • Land | 705 sq mi (1,826 km2) |
| • Water | 15 sq mi (39 km2), 2.1% |
| Population | |
| • (2010) | 63,342 |
| • Density | 90/sq mi (35/km²) |
| Congressional districts | 3rd, 4th |
| Time zone | Eastern: UTC-5/-4 |
| Website |
www |
Montcalm County is a county in the U.S. state of Michigan. The Southwestern Portion of the county ( referring mostly to Greenville) identifies strongly as " West Michigan", while the rest of the county classifies themselves as within the central portion of Lower Michigan. As of the 2010 census, the population was 63,342.[2] The county seat is Stanton.[3] The county is named for General Marquis Louis-Joseph de Montcalm, French military commander of troops in Canada during the French and Indian War. The county was set off in 1831 and organized in 1850.[1]
Montcalm County is part of the Grand Rapids-Wyoming, MI Metropolitan Statistical Area.
Geography
According to the U.S. Census Bureau, the county has a total area of 721 square miles (1,870 km2), of which 705 square miles (1,830 km2) is land and 15 square miles (39 km2) (2.1%) is water.[4]
Adjacent counties
- Isabella County (northeast)
- Mecosta County (north)
- Gratiot County (east)
- Newaygo County (west)
- Ionia County (south)
- Kent County (southwest)
- Clinton County (southeast)
National protected area
- Manistee National Forest (part)
Major highways
Demographics
| Historical population | |||
|---|---|---|---|
| Census | Pop. | %± | |
| 1850 | 891 | — | |
| 1860 | 3,968 | 345.3% | |
| 1870 | 13,629 | 243.5% | |
| 1880 | 33,148 | 143.2% | |
| 1890 | 32,754 | −1.2% | |
| 1900 | 32,754 | 0.0% | |
| 1910 | 32,069 | −2.1% | |
| 1920 | 30,441 | −5.1% | |
| 1930 | 27,471 | −9.8% | |
| 1940 | 28,581 | 4.0% | |
| 1950 | 31,013 | 8.5% | |
| 1960 | 35,795 | 15.4% | |
| 1970 | 39,660 | 10.8% | |
| 1980 | 47,555 | 19.9% | |
| 1990 | 53,059 | 11.6% | |
| 2000 | 61,226 | 15.4% | |
| 2010 | 63,342 | 3.5% | |
| Est. 2015 | 62,945 | [5] | −0.6% |
| U.S. Decennial Census[6] 1790-1960[7] 1900-1990[8] 1990-2000[9] 2010-2013[2] | |||
As of the census[10] of 2000, there were 61,266 people, 22,079 households, and 16,183 families residing in the county. The population density was 86 people per square mile (33/km²). There were 25,900 housing units at an average density of 37 per square mile (14/km²). The racial makeup of the county was 94.83% White, 2.17% Black or African American, 0.60% Native American, 0.26% Asian, 0.05% Pacific Islander, 0.64% from other races, and 1.46% from two or more races. 2.28% of the population were Hispanic or Latino of any race. 25.5% were of English ancestry, 22.5% were of German ancestry, 9.5% were of Irish ancestry, 6.0% were of Dutch ancestry and 5.7% were of Danish ancestry according to the 2010 American Community Survey estimate.[11] 96.4% spoke only English at home, while 2.1% spoke Spanish.
There were 22,079 households out of which 35.30% had children under the age of 18 living with them, 58.80% were married couples living together, 9.70% had a female householder with no husband present, and 26.70% were non-families. 21.90% of all households were made up of individuals and 9.20% had someone living alone who was 65 years of age or older. The average household size was 2.65 and the average family size was 3.07.
In the county the population was spread out with 27.10% under the age of 18, 8.30% from 18 to 24, 30.20% from 25 to 44, 22.30% from 45 to 64, and 12.10% who were 65 years of age or older. The median age was 36 years. For every 100 females there were 105.50 males. For every 100 females age 18 and over, there were 106.00 males.
The median income for a household in the county was $37,218, and the median income for a family was $42,823. Males had a median income of $32,635 versus $23,645 for females. The per capita income for the county was $16,183. About 7.40% of families and 10.90% of the population were below the poverty line, including 14.00% of those under age 18 and 8.70% of those age 65 or over.
Government
The county government operates the jail, maintains rural roads, operates the major local courts, keeps files of deeds and mortgages, maintains vital records, administers public health regulations, and participates with the state in the provision of welfare and other social services. The county board of commissioners controls the budget but has only limited authority to make laws or ordinances. In Michigan, most local government functions — police and fire, building and zoning, tax assessment, street maintenance, etc. — are the responsibility of individual cities and townships.
Elected officials
- Prosecuting Attorney: Andrea Krause
- Sheriff: Bill Barnwell
- County Clerk: Kristen Millard
- County Treasurer: JoAnne Vukin
- Register of Deeds: Lori A. Wilson
- Drain Commissioner: Sandy Rains
- County Commission:Betty Kellenberger; Dale Reyburn; John Johansen; Patric Q. Carr; Ron Baker; Ron Braman; Ron Retzloff; Tom Lindeman; Tom Porter
- Road Commissioners: Dale J. Linton; Bob Brundage; Don McCracken
(information as of July 2015)
Communities
Cities
- Carson City
- Greenville
- Stanton (county seat)
Villages
Unincorporated communities
Townships
- Belvidere Township
- Bloomer Township
- Bushnell Township
- Cato Township
- Crystal Township
- Day Township
- Douglass Township
- Eureka Township
- Evergreen Township
- Fairplain Township
- Ferris Township
- Home Township
- Maple Valley Township
- Montcalm Township
- Pierson Township
- Pine Township
- Reynolds Township
- Richland Township
- Sidney Township
- Winfield Township
See also
- Cowden Lake
- List of Michigan State Historic Sites in Montcalm County, Michigan
- National Register of Historic Places listings in Montcalm County, Michigan
References
- 1 2 "Bibliography on Montcalm County". Clarke Historical Library, Central Michigan University. Retrieved January 20, 2013.
- 1 2 "State & County QuickFacts". United States Census Bureau. Retrieved August 28, 2013.
- ↑ "Find a County". National Association of Counties. Retrieved 2011-06-07.
- ↑ "2010 Census Gazetteer Files". United States Census Bureau. August 22, 2012. Retrieved September 27, 2014.
- ↑ "County Totals Dataset: Population, Population Change and Estimated Components of Population Change: April 1, 2010 to July 1, 2015". Retrieved July 2, 2016.
- ↑ "U.S. Decennial Census". United States Census Bureau. Retrieved September 27, 2014.
- ↑ "Historical Census Browser". University of Virginia Library. Retrieved September 27, 2014.
- ↑ "Population of Counties by Decennial Census: 1900 to 1990". United States Census Bureau. Retrieved September 27, 2014.
- ↑ "Census 2000 PHC-T-4. Ranking Tables for Counties: 1990 and 2000" (PDF). United States Census Bureau. Retrieved September 27, 2014.
- ↑ "American FactFinder". United States Census Bureau. Retrieved 2008-01-31.
- ↑ http://www.census.gov/acs/www/data_documentation/2010_release/
External links
- Montcalm County government
- Ionia Montcalm Magazine website
- "Bibliography on Montcalm County". Clarke Historical Library, Central Michigan University. Retrieved January 20, 2013.
 |
Mecosta County | Isabella County | | |
| Newaygo County | |
Gratiot County | ||
| ||||
| | ||||
| Kent County | Ionia County | Clinton County |
Municipalities and communities of Montcalm County, Michigan, United States | ||
|---|---|---|
| Cities | | |
| Villages | ||
| Charter township | ||
| General law townships | ||
Coordinates: 43°19′N 85°09′W / 43.31°N 85.15°W