List of municipalities in Alberta
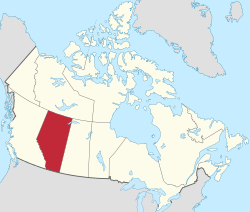
Alberta is the fourth-most populous province in Canada with 3,645,257 residents as of 2011 and is the fourth-largest in land area at approximately 640,000 km2 (250,000 sq mi).[1] Alberta's 354 municipalities cover 98.9% of the province's land mass and are home to 98.6% of its population.[2][3][lower-alpha 1] These municipalities provide local government services, including roads, water, sewer and garbage collection among others, and a variety of programs to their residents.[4][5]
According to the Municipal Government Act (MGA), which was enacted in 2000, a municipality in Alberta is "a city, town, village, summer village, municipal district or specialized municipality, a town under the Parks Towns Act, or a municipality formed by special Act".[6] The MGA also recognizes improvement districts and special areas as municipal authorities while Metis settlements are recognized as municipalities by the Government of Alberta's Ministry of Municipal Affairs.[6][7] Cities, towns, villages, summer villages, municipal districts, specialized municipalities and improvement districts are formed under the provincial authority of the MGA.[6] Special areas and Metis settlements are formed under the provincial authority of the Special Areas Act (SAA) and the Metis Settlements Act (MSA) respectively, of which both were enacted in 2000.[8][9] As provincial law, the MGA, the SAA and the MSA were passed by the Legislative Assembly of Alberta with royal assent granted by the Lieutenant Governor.[10]
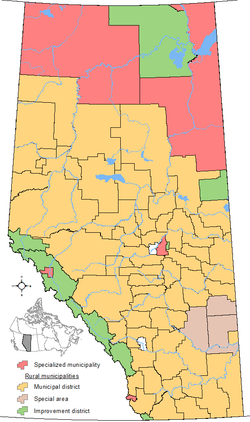
Of Alberta's 354 municipalities, 266 of them are urban municipalities (18 cities, 107 towns, 90 villages and 51 summer villages), 5 are specialized municipalities, 75 are rural municipalities (64 municipal districts, 8 improvement districts and 3 special areas) and 8 are Metis settlements.[2] The MGA, the SAA and the MSA stipulate governance of these municipalities.[6][8][9] Alberta's Ministry of Municipal Affairs is responsible for providing provincial services to municipalities.[11]
Over half of Alberta's population resides in its two largest cities. Calgary, the largest city, is home to 30% of the province's population (1,096,833 residents), while Edmonton, Alberta's capital city, is home to 22% (812,201 residents).[3] Improvement District No. 25 (Willmore Wilderness) and Improvement District No. 349 are Alberta's smallest municipalities by population; both are unpopulated.[3][12] The largest municipality by land area is Mackenzie County at 80,478 km2 (31,073 sq mi), while the smallest by land area is the Summer Village of Castle Island at 0.05 km2 (0.019 sq mi).[3]
Urban municipalities
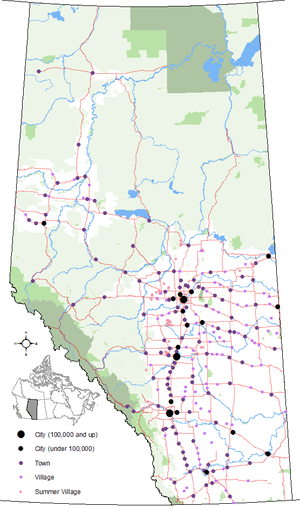
Alberta's Municipal Government Act (MGA), enacted in 2000, defines urban municipality as a "city, town, village or summer village."[6] For federal census purposes, Statistics Canada recognizes all four urban municipality types as census subdivisions.[13]
Combined, Alberta has 266 urban municipalities comprising 18 cities, 107 towns, 90 villages and 51 summer villages.[2] The 266 urban municipalities have a total population of 2,953,387, a total land area of 3,783 km2 (1,461 sq mi), and an average population of 11,145. These totals represent 81% of Alberta's population yet only 0.6% of its land area.
Cities
The MGA stipulates that an area may incorporate as a city if it has a population of 10,000 people or more and the majority of its buildings are on parcels of land smaller than 1,850 m2 (19,900 sq ft).[6] Alberta has 18 cities that had a cumulative population of 2,474,510 and an average population of 137,472 in the 2011 census.[2][3] These 18 cities include Lloydminster, of which a portion is located within the neighbouring province of Saskatchewan.[14] Alberta's largest city by population and land area is Calgary with 1,096,833 and 825 km2 (319 sq mi), while Lacombe is its smallest city by population with 11,707 and Brooks is its smallest city by land area with 18 km2 (6.9 sq mi).[3] Chestermere is Alberta's newest city, which changed from a town to a city on January 1, 2015.[15]
Of Alberta's 18 cities, Cold Lake and Fort Saskatchewan have less than the current minimum density requirement of 400 residents per square kilometre. Cold Lake and Fort Saskatchewan were incorporated as a town and city respectively prior to the MGA being enacted in 2000.[6][16]
Towns
The MGA stipulates that an area may incorporate as a town if it has a population of 1,000 people or more and the majority of its buildings are on parcels of land smaller than 1,850 m2 (19,900 sq ft).[6] Alberta has 107 towns that had a cumulative population of 437,006 and an average population of 4,084 in the 2011 census.[2][3] The province's largest and smallest towns by population are Okotoks and Granum with 24,511 and 447 respectively, while its largest and smallest by land area are Drumheller and Eckville with 108 km2 (42 sq mi) and 1.6 km2 (0.62 sq mi) respectively.[3] Onoway is Alberta's newest town, which changed from a village to a town on September 1, 2005.[17]
Of Alberta's 107 towns, 14 have populations less than the current minimum population requirement of 1,000 and 61 have less than the current minimum density requirement of 400 residents per square kilometre. All of these were incorporated as either towns or villages prior to the MGA being enacted in 2000.[6][17]
Villages
The MGA stipulates that an area may incorporate as a village if it has a population of 300 people or more and the majority of its buildings are on parcels of land smaller than 1,850 m2 (19,900 sq ft).[6] Alberta has 90 villages that had a cumulative population of 38,223 and an average population of 425 in the 2011 census.[2][3] The province's largest and smallest villages by population are Stirling and Gadsby with 1,090 and 25 respectively, while its largest and smallest by land area are Chipman and Edberg with 9.6 km2 (3.7 sq mi) and 0.4 km2 (0.15 sq mi) respectively.[3] The last communities to incorporate as villages were Alberta Beach and Spring Lake, which both changed from summer villages to villages on January 1, 1999.[18]
Of Alberta's 90 villages, 37 have populations less than the current minimum population requirement of 300 and 75 have less than the current minimum density requirement of 400 residents per square kilometre. All of these were incorporated as villages prior to the MGA being enacted in 2000.[6][18]
Summer villages
Under previous legislation, a community could incorporate as a summer village if it had "a minimum of 50 separate buildings occupied as dwellings at any time during a six-month period".[19] A community can no longer incorporate as a summer village under the MGA.[6][20]
Alberta has 51 summer villages that had a cumulative population of 4,586 and an average population of 90 in the 2011 census.[2][3] The province's largest summer village by population is Island Lake with 243, while Betula Beach and Kapasiwin are Alberta's smallest summer villages with a population of 10 each.[3][lower-alpha 2] The province's largest and smallest summer villages by land area are Sandy Beach and Castle Island with 2.4 km2 (0.93 sq mi) and 0.05 km2 (0.019 sq mi) respectively.[3] Gull Lake and Kapasiwin were the last communities in Alberta to incorporate as summer villages. Both were incorporated on September 1, 1993.[22] Since then, two summer villages have incorporated as villages (Alberta Beach and Edmonton Beach, now named Spring Lake) and one has dissolved (White Gull).[18][23]
List of urban municipalities
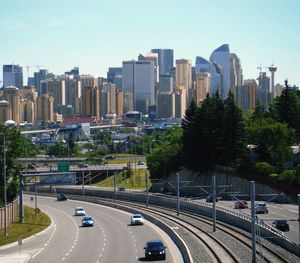 Calgary, Alberta's largest city
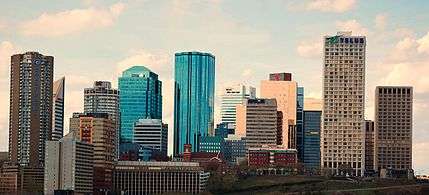 Edmonton, Alberta's capital and second largest city
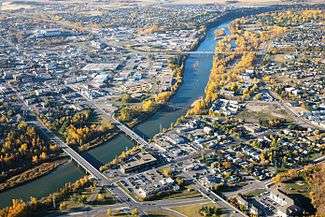 Red Deer, Alberta's third largest city, is located at the midpoint between Calgary and Edmonton.
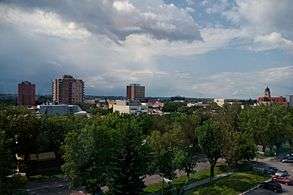 Lethbridge is Alberta's fourth largest city.
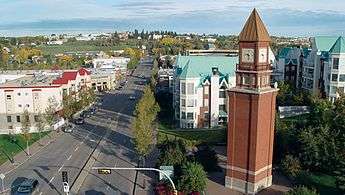 St. Albert, Alberta's fifth largest city, is located adjacent to Edmonton.
| Urban municipalities of Alberta | |||||||
|---|---|---|---|---|---|---|---|
| Name | Status[2] | Incorporation date (current status)[16] |
Population (2011)[3] |
Population (2006)[3] |
Change (%)[3] |
Land area (km²)[3] |
Population density (per km²)[3] |
| Acme | Village | July 7, 1910 | 653 | 656 | −0.5 | 2.47 | 263.9 |
| Airdrie | City | January 1, 1985 | 42,564 | 28,927 | 47.1 | 33.10 | 1,286.0 |
| Alberta Beach | Village | January 1, 1999 | 865 | 884 | −2.1 | 1.98 | 436.7 |
| Alix | Village | June 3, 1907 | 830 | 851 | −2.5 | 3.15 | 263.4 |
| Alliance | Village | August 26, 1918 | 174 | 158 | 10.1 | 0.64 | 270.1 |
| Amisk | Village | January 1, 1956 | 207 | 172 | 20.3 | 0.76 | 272.2 |
| Andrew | Village | June 24, 1930 | 379 | 465 | −18.5 | 1.23 | 308.7 |
| Argentia Beach | Summer village | January 1, 1967 | 15 | 52 | −71.2 | 0.69 | 21.6 |
| Arrowwood | Village | May 13, 1926 | 188 | 221 | −14.9 | 0.66 | 286.1 |
| Athabasca[lower-alpha 3] | Town | September 19, 1911 | 2,990 | 2,580 | 15.9 | 17.48 | 171.1 |
| Banff | Town | January 1, 1990 | 7,584 | 6,700 | 13.2 | 4.88 | 1,555.0 |
| Barnwell | Village | January 1, 1980 | 771 | 618 | 24.8 | 1.49 | 517.2 |
| Barons | Village | May 6, 1910 | 315 | 276 | 14.1 | 0.68 | 462.2 |
| Barrhead | Town | November 26, 1946 | 4,432 | 4,209 | 5.3 | 8.10 | 547.2 |
| Bashaw | Town | May 1, 1964 | 873 | 796 | 9.7 | 2.84 | 306.9 |
| Bassano | Town | January 16, 1911 | 1,282 | 1,345 | −4.7 | 5.16 | 248.6 |
| Bawlf | Village | October 12, 1906 | 403 | 367 | 9.8 | 0.96 | 418.5 |
| Beaumont | Town | January 1, 1980 | 13,284 | 8,961 | 48.2 | 10.50 | 1,264.8 |
| Beaverlodge | Town | January 24, 1956 | 2,365 | 2,264 | 4.5 | 5.58 | 424.0 |
| Beiseker | Village | February 23, 1921 | 785 | 804 | −2.4 | 2.84 | 276.8 |
| Bentley | Town | January 1, 2001 | 1,073 | 1,083 | −0.9 | 2.30 | 466.3 |
| Berwyn | Village | November 28, 1936 | 526 | 516 | 1.9 | 1.66 | 316.7 |
| Betula Beach | Summer village | January 1, 1960 | 10 | 15 | −33.3 | 0.18 | 54.5 |
| Big Valley | Village | March 9, 1942 | 364 | 351 | 3.7 | 1.84 | 198.3 |
| Birch Cove | Summer village | December 31, 1988 | 45 | 38 | 18.4 | 0.29 | 157.8 |
| Birchcliff | Summer village | January 1, 1972 | 112 | 125 | −10.4 | 0.98 | 114.0 |
| Bittern Lake[lower-alpha 4] | Village | November 2, 1904 | 224 | 225 | −0.4 | 6.64 | 33.7 |
| Black Diamond | Town | January 1, 1956 | 2,373 | 1,900 | 24.9 | 3.21 | 740.3 |
| Blackfalds | Town | April 1, 1980 | 6,300 | 4,618 | 36.4 | 16.36 | 385.0 |
| Bon Accord | Town | November 20, 1979 | 1,488 | 1,534 | −3.0 | 2.11 | 706.2 |
| Bondiss | Summer village | January 1, 1983 | 106 | 131 | −19.1 | 1.33 | 79.9 |
| Bonnyville | Town | February 3, 1948 | 6,216 | 5,832 | 6.6 | 14.10 | 440.7 |
| Bonnyville Beach | Summer village | January 1, 1958 | 95 | 97 | −2.1 | 0.38 | 253.2 |
| Botha | Village | September 5, 1911 | 175 | 185 | −5.4 | 1.09 | 160.7 |
| Bow Island | Town | February 1, 1912 | 2,025 | 1,790 | 13.1 | 5.92 | 342.1 |
| Bowden | Town | September 1, 1981 | 1,241 | 1,210 | 2.6 | 2.73 | 454.7 |
| Boyle | Village | December 31, 1953 | 916 | 854 | 7.3 | 7.28 | 125.8 |
| Breton | Village | January 1, 1957 | 496 | 550 | −9.8 | 1.73 | 286.5 |
| Brooks | City | September 1, 2005 | 13,676 | 12,508 | 9.3 | 18.19 | 751.9 |
| Bruderheim | Town | September 17, 1980 | 1,155 | 1,215 | −4.9 | 4.23 | 273.2 |
| Burnstick Lake | Summer village | December 31, 1991 | 16 | 43 | −62.8 | 0.18 | 89.9 |
| Calgary | City | January 1, 1894 | 1,096,833 | 988,812 | 10.9 | 825.29 | 1,329.0 |
| Calmar | Town | January 19, 1954 | 1,970 | 1,959 | 0.6 | 4.65 | 423.7 |
| Camrose | City | January 1, 1955 | 17,286 | 15,630 | 10.6 | 42.50 | 406.7 |
| Canmore | Town | June 1, 1966 | 12,288 | 12,039 | 2.1 | 68.90 | 178.4 |
| Carbon | Village | November 18, 1912 | 592 | 570 | 3.9 | 2.00 | 295.6 |
| Cardston | Town | July 2, 1901 | 3,580 | 3,452 | 3.7 | 8.64 | 414.1 |
| Carmangay | Village | March 4, 1936 | 367 | 336 | 9.2 | 1.86 | 197.1 |
| Caroline | Village | December 31, 1951 | 501 | 515 | −2.7 | 1.98 | 252.8 |
| Carstairs | Town | September 1, 1966 | 3,442 | 2,699 | 27.5 | 11.53 | 298.4 |
| Castle Island | Summer village | January 1, 1955 | 19 | 22 | −13.6 | 0.05 | 361.9 |
| Castor | Town | June 27, 1910 | 932 | 931 | 0.1 | 2.72 | 343.1 |
| Cereal | Village | August 19, 1914 | 134 | 126 | 6.3 | 0.95 | 141.6 |
| Champion | Village | May 27, 1911 | 378 | 364 | 3.8 | 0.88 | 429.7 |
| Chauvin | Village | December 30, 1912 | 334 | 308 | 8.4 | 2.32 | 143.9 |
| Chestermere[lower-alpha 5] | City | January 1, 2015[15] | 14,824 | 9,923 | 49.4 | 32.64 | 454.1 |
| Chipman | Village | October 21, 1913 | 284 | 253 | 12.3 | 9.61 | 29.5 |
| Claresholm | Town | August 31, 1905 | 3,758 | 3,700 | 1.6 | 9.08 | 414.0 |
| Clive | Village | January 9, 1912 | 675 | 562 | 20.1 | 2.12 | 318.3 |
| Clyde | Village | January 28, 1914 | 503 | 470 | 7.0 | 1.36 | 370.7 |
| Coaldale | Town | January 7, 1952 | 7,493 | 6,177 | 21.3 | 7.95 | 942.8 |
| Coalhurst | Town | June 1, 1995 | 1,963 | 1,523 | 28.9 | 2.39 | 820.3 |
| Cochrane | Town | February 15, 1971 | 17,580 | 13,760 | 27.8 | 30.03 | 585.5 |
| Cold Lake | City | October 1, 2000 | 13,839 | 11,991 | 15.4 | 59.30 | 233.4 |
| Consort | Village | September 23, 1912 | 689 | 739 | −6.8 | 2.83 | 243.3 |
| Coronation | Town | April 29, 1912 | 947 | 1,015 | −6.7 | 3.73 | 253.6 |
| Coutts | Village | January 1, 1960 | 277 | 305 | −9.2 | 0.98 | 283.3 |
| Cowley | Village | August 16, 1906 | 236 | 219 | 7.8 | 1.40 | 168.8 |
| Cremona | Village | January 1, 1955 | 457 | 463 | −1.3 | 1.71 | 267.8 |
| Crossfield | Town | August 1, 1980 | 2,853 | 2,668 | 6.9 | 11.87 | 240.3 |
| Crystal Springs | Summer village | January 1, 1957 | 90 | 112 | −19.6 | 0.58 | 156.0 |
| Czar | Village | November 12, 1917 | 167 | 175 | −4.6 | 1.18 | 141.6 |
| Daysland | Town | April 2, 1907 | 807 | 818 | −1.3 | 1.75 | 461.2 |
| Delburne | Village | January 17, 1913 | 830 | 765 | 8.5 | 3.92 | 211.5 |
| Delia[lower-alpha 6] | Village | July 20, 1914 | 186 | 207 | −10.1 | 1.31 | 142.5 |
| Devon | Town | February 24, 1950 | 6,510 | 6,261 | 4.0 | 11.72 | 555.6 |
| Dewberry | Village | January 1, 1957 | 201 | 196 | 2.6 | 0.84 | 238.5 |
| Didsbury | Town | September 27, 1906 | 4,957 | 4,305 | 15.1 | 16.08 | 308.2 |
| Donalda | Village | December 30, 1912 | 259 | 224 | 15.6 | 0.99 | 262.3 |
| Donnelly | Village | January 1, 1956 | 305 | 293 | 4.1 | 1.27 | 239.9 |
| Drayton Valley | Town | February 1, 1957 | 7,049 | 6,893 | 2.3 | 12.27 | 574.3 |
| Drumheller[lower-alpha 7] | Town | March 2, 1916 January 1, 1998 | 8,029 | 7,932 | 1.2 | 107.93 | 74.4 |
| Duchess | Village | May 12, 1921 | 992 | 978 | 1.4 | 1.89 | 526.2 |
| Eckville | Town | July 1, 1966 | 1,125 | 951 | 18.3 | 1.58 | 710.8 |
| Edberg | Village | February 4, 1930 | 168 | 155 | 8.4 | 0.36 | 470.9 |
| Edgerton | Village | September 11, 1917 | 317 | 373 | −15.0 | 1.89 | 168.1 |
| Edmonton | City | October 8, 1904 | 812,201 | 730,372 | 11.2 | 684.37 | 1,186.8 |
| Edson | Town | September 21, 1911 | 8,475 | 8,098 | 4.7 | 29.58 | 286.5 |
| Elk Point | Town | January 1, 1962 | 1,412 | 1,487 | −5.0 | 4.88 | 289.1 |
| Elnora | Village | July 22, 1929 | 313 | 280 | 11.8 | 1.48 | 210.9 |
| Empress | Village | February 5, 1914 | 188 | 136 | 38.2 | 1.75 | 107.6 |
| Fairview | Town | April 25, 1949 | 3,162 | 3,297 | −4.1 | 11.30 | 279.8 |
| Falher | Town | January 1, 1955 | 1,075 | 941 | 14.2 | 2.87 | 374.7 |
| Ferintosh | Village | January 9, 1911 | 181 | 153 | 18.3 | 0.62 | 290.2 |
| Foremost | Village | December 31, 1950 | 526 | 524 | 0.4 | 1.89 | 277.8 |
| Forestburg | Village | August 21, 1919 | 831 | 895 | −7.2 | 2.75 | 302.0 |
| Fort Macleod[lower-alpha 8] | Town | March 29, 1912 | 3,117 | 3,072 | 1.5 | 23.34 | 133.5 |
| Fort Saskatchewan | City | July 1, 1985 | 19,051 | 14,957 | 27.4 | 48.12 | 395.9 |
| Fox Creek | Town | September 1, 1983 | 1,969 | 2,278 | −13.6 | 11.54 | 170.6 |
| Gadsby | Village | May 6, 1910 | 25 | 35 | −28.6 | 0.82 | 30.5 |
| Ghost Lake | Summer village | December 31, 1953 | 81 | 78 | 3.8 | 0.63 | 129.4 |
| Gibbons | Town | April 1, 1977 | 3,030 | 2,642 | 14.7 | 7.39 | 409.9 |
| Girouxville | Village | December 31, 1951 | 266 | 282 | −5.7 | 0.58 | 461.2 |
| Glendon | Village | January 1, 1956 | 486 | 421 | 15.4 | 1.98 | 245.1 |
| Glenwood | Village | January 1, 1961 | 287 | 280 | 2.5 | 1.46 | 197.2 |
| Golden Days | Summer village | January 1, 1965 | 141 | 207 | −31.9 | 2.27 | 62.0 |
| Grande Cache | Town | September 1, 1983 | 4,319 | 3,783 | 14.2 | 35.48 | 121.7 |
| Grande Prairie | City | January 1, 1958 | 55,032 | 47,107 | 16.8 | 72.80 | 755.9 |
| Grandview | Summer village | January 1, 1967 | 108 | 127 | −15.0 | 0.80 | 135.6 |
| Granum[lower-alpha 9] | Town | November 7, 1910 | 447 | 415 | 7.7 | 1.87 | 239.6 |
| Grimshaw | Town | February 2, 1953 | 2,515 | 2,537 | −0.9 | 7.21 | 349.0 |
| Gull Lake | Summer village | September 1, 1993 | 122 | 204 | −40.2 | 0.70 | 174.9 |
| Half Moon Bay | Summer village | January 1, 1978 | 38 | 32 | 18.8 | 0.17 | 229.2 |
| Halkirk | Village | February 10, 1912 | 121 | 113 | 7.1 | 0.65 | 185.7 |
| Hanna | Town | April 14, 1914 | 2,673 | 2,847 | −6.1 | 8.56 | 312.4 |
| Hardisty | Town | November 9, 1910 | 639 | 760 | −15.9 | 5.48 | 116.6 |
| Hay Lakes[lower-alpha 10] | Village | April 17, 1928 | 425 | 362 | 17.4 | 0.58 | 730.1 |
| Heisler | Village | January 1, 1961 | 151 | 153 | −1.3 | 0.76 | 199.9 |
| High Level | Town | September 1, 1983 | 3,641 | 3,887 | −6.3 | 31.99 | 113.8 |
| High Prairie | Town | January 10, 1950 | 2,600 | 2,785 | −6.6 | 7.92 | 328.2 |
| High River | Town | February 12, 1906 | 12,920 | 10,716 | 20.6 | 14.27 | 905.5 |
| Hill Spring | Village | January 1, 1961 | 186 | 192 | −3.1 | 1.11 | 167.2 |
| Hines Creek | Village | December 31, 1951 | 380 | 430 | −11.6 | 4.37 | 86.9 |
| Hinton | Town | December 29, 1958 | 9,640 | 9,738 | −1.0 | 33.77 | 285.4 |
| Holden | Village | April 14, 1909 | 381 | 398 | −4.3 | 1.70 | 224.3 |
| Horseshoe Bay | Summer village | January 1, 1985 | 37 | 214 | −82.7 | 1.04 | 35.4 |
| Hughenden | Village | December 27, 1917 | 230 | 231 | −0.4 | 0.78 | 296.6 |
| Hussar | Village | April 20, 1928 | 176 | 187 | −5.9 | 0.99 | 177.8 |
| Hythe | Village | August 31, 1929 | 820 | 821 | −0.1 | 4.12 | 198.8 |
| Innisfail | Town | November 20, 1903 | 7,876 | 7,331 | 7.4 | 19.53 | 403.2 |
| Innisfree | Village | March 11, 1911 | 220 | 233 | −5.6 | 1.27 | 172.6 |
| Irma | Village | May 30, 1912 | 457 | 444 | 2.9 | 1.11 | 410.7 |
| Irricana | Town | June 9, 2005 | 1,162 | 1,243 | −6.5 | 3.18 | 364.9 |
| Island Lake South | Summer village | January 1, 1983 | 72 | 105 | −31.4 | 0.63 | 114.3 |
| Island Lake | Summer village | January 1, 1958 | 243 | 351 | −30.8 | 1.45 | 167.8 |
| Itaska Beach | Summer village | June 30, 1953 | 20 | 35 | −42.9 | 0.28 | 70.8 |
| Jarvis Bay | Summer village | January 1, 1986 | 203 | 183 | 10.9 | 0.55 | 371.1 |
| Kapasiwin | Summer village | September 1, 1993 | 10 | 15[26] | −33.3 | 0.31 | 32.3 |
| Killam | Town | May 1, 1965 | 981 | 1,019 | −3.7 | 4.53 | 216.3 |
| Kitscoty | Village | March 22, 1911 | 846 | 709 | 19.3 | 1.54 | 549.8 |
| Lacombe | City | September 5, 2010 | 11,707 | 10,752 | 8.9 | 20.89 | 560.3 |
| Lakeview | Summer village | October 25, 1913 | 26 | 36 | −27.8 | 0.33 | 78.8 |
| Lamont | Town | May 31, 1968 | 1,753 | 1,669 | 5.0 | 9.27 | 189.2 |
| Larkspur | Summer village | January 1, 1985 | 38 | 56 | −32.1 | 0.22 | 172.0 |
| Leduc | City | September 1, 1983 | 24,279 | 16,967 | 43.1 | 36.97 | 656.7 |
| Legal | Town | January 1, 1998 | 1,225 | 1,192 | 2.8 | 3.22 | 381.0 |
| Lethbridge | City | May 9, 1906 | 83,517 | 74,685 | 11.8 | 122.36 | 682.6 |
| Linden | Village | January 1, 1964 | 725 | 660 | 9.8 | 2.56 | 283.3 |
| Lloydminster (part)[lower-alpha 11] | City | January 1, 1958 | 18,032 | 15,910 | 13.3 | 24.19 | 745.6 |
| Lomond | Village | February 16, 1916 | 173 | 175 | −1.1 | 1.28 | 134.9 |
| Longview | Village | January 1, 1964 | 307 | 300 | 2.3 | 1.09 | 282.1 |
| Lougheed | Village | November 7, 1911 | 233 | 217 | 7.4 | 1.92 | 121.5 |
| Magrath | Town | July 24, 1907 | 2,217 | 2,081 | 6.5 | 4.97 | 446.2 |
| Ma-Me-O Beach | Summer village | December 31, 1948 | 113 | 155 | −27.1 | 0.65 | 173.4 |
| Manning | Town | January 1, 1957 | 1,164 | 1,493 | −22.0 | 3.42 | 340.0 |
| Mannville | Village | December 29, 1906 | 803 | 782 | 2.7 | 2.15 | 373.6 |
| Marwayne | Village | December 31, 1952 | 612 | 521 | 17.5 | 1.68 | 364.5 |
| Mayerthorpe | Town | March 20, 1961 | 1,398 | 1,474 | −5.2 | 4.78 | 292.7 |
| McLennan | Town | February 11, 1948 | 809 | 824 | −1.8 | 3.58 | 226.2 |
| Medicine Hat | City | May 9, 1906 | 60,005 | 56,997 | 5.3 | 112.01 | 535.7 |
| Mewatha Beach | Summer village | January 1, 1978 | 79 | 167 | −52.7 | 0.78 | 101.9 |
| Milk River | Town | February 7, 1956 | 811 | 816 | −0.6 | 2.39 | 339.6 |
| Millet | Town | September 1, 1983 | 2,092 | 2,068 | 1.2 | 3.74 | 558.7 |
| Milo | Village | May 7, 1931 | 122 | 100 | 22.0 | 1.04 | 116.9 |
| Morinville | Town | April 21, 1911 | 8,569 | 6,775 | 26.5 | 11.34 | 755.6 |
| Morrin | Village | April 16, 1920 | 245 | 253 | −3.2 | 0.82 | 298.9 |
| Mundare | Town | January 4, 1951 | 855 | 712 | 20.1 | 4.20 | 203.6 |
| Munson | Village | May 5, 1911 | 204 | 217 | −6.0 | 2.60 | 78.5 |
| Myrnam | Village | August 22, 1930 | 370 | 362 | 2.2 | 2.76 | 134.2 |
| Nakamun Park | Summer village | January 1, 1966 | 36 | 88 | −59.1 | 0.41 | 88.7 |
| Nampa | Village | January 1, 1958 | 362 | 360 | 0.6 | 1.86 | 194.9 |
| Nanton | Town | August 9, 1907 | 2,132 | 2,055 | 3.7 | 4.80 | 443.9 |
| Nobleford | Village | February 28, 1918 | 1,000 | 689 | 45.1 | 1.54 | 647.8 |
| Norglenwold | Summer village | January 1, 1965 | 232 | 270 | −14.1 | 0.67 | 345.2 |
| Norris Beach | Summer village | December 31, 1988 | 46 | 40 | 15.0 | 0.16 | 285.5 |
| Okotoks | Town | June 1, 1904 | 24,511 | 17,150 | 42.9 | 19.24 | 1,273.8 |
| Olds | Town | July 1, 1905 | 8,235 | 7,253 | 13.5 | 14.87 | 553.8 |
| Onoway | Town | September 1, 2005 | 1,039 | 875 | 18.7 | 3.34 | 311.5 |
| Oyen | Town | September 1, 1965 | 973 | 1,015 | −4.1 | 4.93 | 197.4 |
| Paradise Valley | Village | January 1, 1964 | 174 | 183 | −4.9 | 0.57 | 306.9 |
| Parkland Beach | Summer village | January 1, 1984 | 124 | 135 | −8.1 | 0.93 | 133.8 |
| Peace River[lower-alpha 12] | Town | December 1, 1919 | 6,729[28] | 6,315 | 6.6 | 25.92 | 259.6 |
| Pelican Narrows | Summer village | July 1, 1979 | 162 | 141 | 14.9 | 0.70 | 230.0 |
| Penhold | Town | September 1, 1980 | 2,375 | 1,971 | 20.5 | 5.33 | 445.3 |
| Picture Butte | Town | January 1, 1960 | 1,650 | 1,592 | 3.6 | 2.90 | 569.5 |
| Pincher Creek | Town | May 12, 1906 | 3,685 | 3,625 | 1.7 | 10.19 | 361.6 |
| Point Alison | Summer village | December 31, 1950 | 15 | 15 | 0.0 | 0.16 | 92.9 |
| Ponoka | Town | October 15, 1904 | 6,773 | 6,576 | 3.0 | 13.05 | 519.2 |
| Poplar Bay | Summer village | January 1, 1967 | 80 | 84 | −4.8 | 0.79 | 101.0 |
| Provost | Town | December 29, 1952 | 2,041 | 2,072 | −1.5 | 4.93 | 413.8 |
| Rainbow Lake | Town | September 1, 1995 | 870 | 965 | −9.8 | 11.04 | 78.8 |
| Raymond | Town | July 1, 1903 | 3,743 | 3,225 | 16.1 | 6.85 | 546.1 |
| Red Deer | City | March 25, 1913 | 90,564 | 83,154 | 8.9 | 104.29 | 868.4 |
| Redcliff | Town | August 5, 1912 | 5,588 | 5,116 | 9.2 | 16.20 | 344.9 |
| Redwater | Town | December 31, 1950 | 1,915 | 2,202 | −13.0 | 20.12 | 95.2 |
| Rimbey | Town | December 13, 1948 | 2,378 | 2,252 | 5.6 | 11.34 | 209.7 |
| Rochon Sands | Summer village | May 17, 1929 | 65[28] | 66 | −1.5 | 2.32 | 28.0 |
| Rocky Mountain House | Town | August 31, 1939 | 6,933 | 6,874 | 0.9 | 12.99 | 533.6 |
| Rockyford | Village | March 28, 1919 | 325 | 349 | −6.9 | 1.08 | 300.0 |
| Rosalind | Village | January 1, 1966 | 190 | 190 | 0.0 | 0.59 | 322.2 |
| Rosemary | Village | December 31, 1951 | 342 | 388 | −11.9 | 0.56 | 607.8 |
| Ross Haven | Summer village | January 1, 1962 | 137 | 198 | −30.8 | 0.70 | 194.5 |
| Rycroft | Village | March 15, 1944 | 628 | 638 | −1.6 | 1.69 | 372.5 |
| Ryley[lower-alpha 13] | Village | April 2, 1910 | 497 | 458 | 8.5 | 1.97 | 251.9 |
| Sandy Beach | Summer village | January 1, 1956 | 223 | 239 | −6.7 | 2.43 | 91.8 |
| Seba Beach | Summer village | August 20, 1920 | 143 | 203 | −29.6 | 0.71 | 201.1 |
| Sedgewick | Town | May 1, 1966 | 857 | 891 | −3.8 | 2.60 | 329.1 |
| Sexsmith | Town | October 15, 1979 | 2,418 | 1,969 | 22.8 | 13.43 | 180.1 |
| Silver Beach | Summer village | December 31, 1953 | 52 | 47 | 10.6 | 0.66 | 78.2 |
| Silver Sands | Summer village | January 1, 1969 | 85 | 173 | −50.9 | 2.35 | 36.2 |
| Slave Lake | Town | August 2, 1965 | 6,782 | 6,703 | 1.2 | 14.18 | 478.4 |
| Smoky Lake | Town | February 1, 1962 | 1,022 | 1,010 | 1.2 | 4.20 | 243.5 |
| South Baptiste | Summer village | January 1, 1983 | 52 | 69 | −24.6 | 1.05 | 49.6 |
| South View | Summer village | January 1, 1970 | 35 | 115 | −69.6 | 0.69 | 51.0 |
| Spirit River | Town | September 18, 1951 | 1,025 | 1,148 | −10.7 | 2.81 | 365.4 |
| Spring Lake[lower-alpha 14] | Village | January 1, 1999 | 533 | 501 | 6.4 | 2.12 | 251.5 |
| Spruce Grove | City | March 1, 1986 | 26,171 | 19,541 | 33.9 | 32.37 | 808.6 |
| St. Albert | City | January 1, 1977 | 61,466 | 57,764 | 6.4 | 48.27 | 1,273.4 |
| St. Paul[lower-alpha 15] | Town | December 15, 1936 | 5,400 | 5,106 | 5.8 | 7.89 | 684.7 |
| Standard | Village | April 29, 1922 | 379 | 380 | −0.3 | 2.34 | 162.1 |
| Stavely | Town | May 25, 1912 | 505 | 435 | 16.1 | 1.62 | 311.3 |
| Stettler | Town | November 23, 1906 | 5,748 | 5,445 | 5.6 | 13.12 | 438.2 |
| Stirling | Village | September 3, 1901 | 1,090 | 921 | 18.3 | 2.64 | 413.6 |
| Stony Plain | Town | December 10, 1908 | 15,051 | 12,363 | 21.7 | 35.61 | 422.7 |
| Strathmore | Town | July 6, 1911 | 12,305 | 10,280 | 19.7 | 27.28 | 451.0 |
| Sunbreaker Cove | Summer village | December 31, 1990 | 69 | 137 | −49.6 | 0.49 | 140.6 |
| Sundance Beach | Summer village | January 1, 1970 | 82 | 102 | −19.6 | 0.42 | 196.2 |
| Sundre | Town | January 1, 1956 | 2,610 | 2,523 | 3.4 | 11.16 | 233.9 |
| Sunrise Beach | Summer village | December 31, 1988 | 149 | 170 | −12.4 | 1.72 | 86.4 |
| Sunset Beach | Summer village | May 1, 1977 | 44 | 88 | −50.0 | 0.99 | 44.4 |
| Sunset Point | Summer village | January 1, 1959 | 221 | 242 | −8.7 | 1.11 | 198.6 |
| Swan Hills | Town | January 1, 1967 | 1,465 | 1,645 | −10.9 | 25.44 | 57.6 |
| Sylvan Lake | Town | May 20, 1946 | 12,327 | 10,250 | 20.3 | 15.62 | 789.4 |
| Taber | Town | July 1, 1907 | 8,104 | 7,591 | 6.8 | 15.09 | 537.2 |
| Thorsby | Village | December 31, 1949 | 951[28] | 945 | 0.6 | 3.87 | 245.7 |
| Three Hills | Town | January 1, 1929 | 3,198 | 3,089 | 3.5 | 5.63 | 567.8 |
| Tofield | Town | September 10, 1909 | 2,182 | 1,876 | 16.3 | 8.17 | 267.1 |
| Trochu | Town | August 1, 1962 | 1,072 | 1,005 | 6.7 | 2.82 | 380.1 |
| Turner Valley | Town | September 1, 1977 | 2,167 | 1,908 | 13.6 | 5.45 | 397.6 |
| Two Hills | Town | January 1, 1955 | 1,379 | 1,047 | 31.7 | 3.31 | 416.3 |
| Val Quentin | Summer village | January 1, 1966 | 157 | 181 | −13.3 | 0.30 | 522.5 |
| Valleyview | Town | February 5, 1957 | 1,761 | 1,725 | 2.1 | 9.66 | 182.2 |
| Vauxhall | Town | January 1, 1961 | 1,288 | 1,069 | 20.5 | 2.88 | 447.6 |
| Vegreville | Town | August 15, 1906 | 5,717 | 5,519 | 3.6 | 13.92 | 410.6 |
| Vermilion | Town | August 27, 1906 | 3,930 | 4,036 | −2.6 | 13.69 | 287.0 |
| Veteran | Village | June 30, 1914 | 249 | 293 | −15.0 | 0.84 | 297.0 |
| Viking | Town | November 10, 1952 | 1,041 | 1,085 | −4.1 | 3.76 | 277.1 |
| Vilna | Village | June 23, 1923 | 249 | 274 | −9.1 | 0.90 | 277.5 |
| Vulcan | Town | June 15, 1921 | 1,836 | 1,940 | −5.4 | 6.58 | 279.0 |
| Wabamun | Village | January 1, 1980 | 661 | 601 | 10.0 | 3.24 | 203.8 |
| Wainwright | Town | July 14, 1910 | 5,925 | 5,426 | 9.2 | 8.91 | 665.4 |
| Waiparous | Summer village | January 1, 1986 | 42 | 49 | −14.3 | 0.41 | 103.0 |
| Warburg | Village | December 31, 1953 | 789 | 621 | 27.1 | 2.70 | 292.6 |
| Warner | Village | November 12, 1908 | 331 | 307 | 7.8 | 1.15 | 288.5 |
| Waskatenau | Village | May 19, 1932 | 255 | 278 | −8.3 | 0.60 | 427.6 |
| Wembley | Town | August 1, 1980 | 1,383 | 1,443 | −4.2 | 4.54 | 304.8 |
| West Baptiste | Summer village | January 1, 1983 | 52 | 104 | −50.0 | 0.60 | 86.2 |
| West Cove | Summer village | January 1, 1963 | 121 | 169 | −28.4 | 1.21 | 100.1 |
| Westlock | Town | January 7, 1947 | 4,823 | 5,008 | −3.7 | 13.57 | 355.3 |
| Wetaskiwin | City | May 9, 1906 | 12,525 | 11,689 | 7.2 | 18.20 | 688.2 |
| Whispering Hills | Summer village | January 1, 1983 | 108 | 125 | −13.6 | 1.73 | 62.3 |
| White Sands | Summer village | January 1, 1980 | 91 | 120 | −24.2 | 1.60 | 57.0 |
| Whitecourt | Town | December 20, 1971 | 9,605 | 8,971 | 7.1 | 26.14 | 367.4 |
| Willingdon | Village | August 31, 1928 | 275 | 295 | −6.8 | 0.97 | 283.8 |
| Yellowstone | Summer village | January 1, 1965 | 124 | 170 | −27.1 | 0.28 | 438.5 |
| Youngstown | Village | December 31, 1936 | 178 | 170 | 4.7 | 1.00 | 177.7 |
| Total cities | — | — | 2,474,510 | 2,207,686 | 12.1 | 2,335.86 | 1,059.4 |
| Total towns | — | — | 437,006 | 394,739 | 10.7 | 1,241.04 | 352.1 |
| Total villages | — | — | 38,223 | 36,837 | 3.8 | 163.87 | 232.8 |
| Total summer villages | — | — | 4,586 | 6,140 | −25.3 | 41.06 | 111.7 |
| Total urban municipalities | — | — | 2,953,387 | 2,645,467 | 11.6 | 3,782.56 | 780.8 |
| Province of Alberta | — | — | 3,645,257 | 3,290,350 | 10.8 | 640,081.87 | 5.7 |
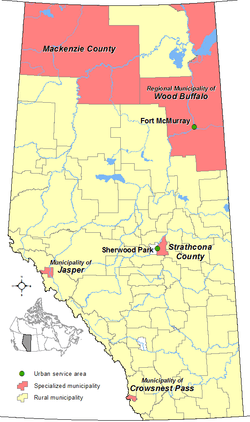
Specialized municipalities
Specialized municipalities in Alberta are unique local governments.[32] Alberta's Municipal Government Act (MGA), enacted in 2000, provides the authority to form a specialized municipality under the following scenarios:[6]
- where the Minister of Municipal Affairs is satisfied that the other incorporated statuses under the MGA do not meet the needs of the proposed municipality's residents;
- to form a local government that, in the opinion of the Minister of Municipal Affairs, will provide for the orderly development of the municipality in a similar fashion to the other incorporated statuses within the MGA, including other previously incorporated specialized municipalities; or
- for any other circumstances that are deemed appropriate by the Minister of Municipal Affairs.
Alberta has five specialized municipalities, which are recognized as census subdivisions by Statistics Canada.[2][13] In the 2011 census, they had a cumulative population of 178,979, a total land area of 146,595 km2 (56,601 sq mi), and an average population of 35,796.[3] These totals represent 5% of Alberta's population yet 22.9% of its land area.
The province's largest and smallest specialized municipalities by population are Strathcona County and the Municipality of Jasper with 92,490 and 4,432 respectively, while its largest and smallest by land area are Mackenzie County and the Municipality of Crowsnest Pass with 80,478 km2 (31,073 sq mi) and 373 km2 (144 sq mi) respectively.[3][28] The Municipality of Crowsnest Pass is Alberta's newest specialized municipality, which was incorporated as a town prior to January 16, 2008.[33] Alberta's first specialized municipality was the Regional Municipality of Wood Buffalo, which formed on April 1, 1995.[33]
Strathcona County and the Regional Municipality (RM) of Wood Buffalo are home to the unincorporated hamlets of Sherwood Park and Fort McMurray respectively.[34] These communities are designated urban service areas, which are deemed equivalents of cities.[35][36] Excluding Sherwood Park and Fort McMurray, 18 other unincorporated communities, also recognized as hamlets by Alberta Municipal Affairs, are distributed among Mackenzie County, Strathcona County and the RM of Wood Buffalo.[34]
List of specialized municipalities
| Specialized municipalities of Alberta | ||||||
|---|---|---|---|---|---|---|
| Name | Incorporation date (specialized municipality)[33] |
Population (2011)[3] |
Population (2006)[3] |
Change (%)[3] |
Land area (km²)[3] |
Population density (per km²)[3] |
| Crowsnest Pass, Municipality of | January 16, 2008 | 5,565 | 5,749 | −3.2 | 373.07 | 14.9 |
| Jasper, Municipality of | July 20, 2001 | 4,432[28] | 4,265 | 3.9 | 925.52 | 4.8 |
| Mackenzie County | June 23, 1999 | 10,927 | 10,002 | 9.2 | 80,478.12 | 0.1 |
| Strathcona County | January 1, 1996 | 92,490 | 82,511 | 12.1 | 1,180.56 | 78.3 |
| Wood Buffalo, Regional Municipality of | April 1, 1995 | 65,565 | 51,924[26] | 26.3 | 63,637.47 | 1.0 |
| Total specialized municipalities | — | 178,979 | 154,451 | 15.9 | 146,594.74 | 1.2 |
| Province of Alberta | — | 3,645,257 | 3,290,350 | 10.8 | 640,081.87 | 5.7 |
Rural municipalities
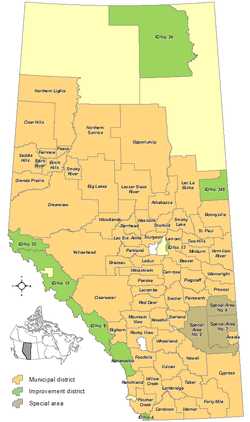
Rural municipalities in Alberta include municipal districts (counties), improvement districts and special areas.[37] For federal census purposes, Statistics Canada recognizes all three rural municipality types as census subdivisions.[13] However, Statistics Canada embeds Alberta's eight Metis settlements, a separate type of municipality, into the census subdivisions for six municipal districts.[38]
Combined, Alberta has 75 rural municipalities comprising 64 municipal districts, 8 improvement districts and 3 special areas.[2] The 75 rural municipalities have a total population of 458,966, a total land area of 483,655 km2 (186,740 sq mi), and an average population of 6,120.[3][lower-alpha 16] These totals represent 13% of Alberta's population yet 75.6% of its land area.
Municipal districts
In Alberta, a municipal district, also known as a county, is a type of rural municipality.[37] The MGA, enacted in 2000, stipulates that an area may incorporate as a municipal district if it has a population of 1,000 people or more and the majority of its buildings are on parcels of land larger than 1,850 m2 (19,900 sq ft).[6]
Alberta has 64 municipal districts that had a cumulative population of 452,321 and an average population of 7,068 in the 2011 census.[2][3][lower-alpha 16] The province's largest and smallest municipal districts by population are Rocky View County and the Municipal District (MD) of Ranchland No. 66 with 36,461 and 79 respectively, while its largest and smallest by land area are the MD of Greenview No. 16 and the MD of Spirit River No. 133 with 32,989 km2 (12,737 sq mi) and 684 km2 (264 sq mi) respectively.[3] Lac La Biche County is Alberta's newest municipal district, which was formed on August 1, 2007 through the amalgamation of the former Town of Lac La Biche and the former Lakeland County.[39] Unincorporated communities recognized as hamlets by Alberta Municipal Affairs are located within every municipal district with the exception of Mountain View County, the MD of Ranchland No. 66 and the MD of Spirit River No. 133.[34]
Of Alberta's 64 municipal districts, 3 have populations less than the current minimum population requirement of 1,000. All of these were incorporated as municipal districts prior to the MGA being enacted in 2000.[6][39]
Improvement districts
In Alberta, an improvement district is a type of rural municipality that can be incorporated by the Lieutenant Governor in Council on the recommendation of Alberta's Minister of Municipal Affairs under the authority of the MGA.[6][37] Improvement districts are administered by the Province of Alberta through its Ministry of Municipal Affairs.[37]
Alberta has eight improvement districts that had a cumulative population of 2,146 and an average population of 268 in the 2011 census.[2][3] Five of them are within national parks while two are within provincial parks.[37] Alberta's largest improvement district by population is Improvement District (ID) No. 9, located within Banff National Park, with 1,175, while its largest by land area is ID No. 24, located within Wood Buffalo National Park, with 33,412 km2 (12,900 sq mi).[3][37] ID No. 25 (Willmore Wilderness) and ID No. 349 are Alberta's two unpopulated improvement districts, while its smallest by land area is ID No. 13 (Elk Island) with 165 km2 (64 sq mi).[3][12] ID No. 349 is also Alberta's newest improvement district, which was formed on January 1, 2012 from portions of Lac La Biche County and the Regional Municipality of Wood Buffalo.[40] Alberta Municipal Affairs recognizes two unincorporated communities within improvement districts as hamlets – Lake Louise within ID No. 9 (Banff National Park) and Waterton Park within ID No. 4 (Waterton Lakes National Park).[34]
Special areas
In Alberta, a special area is a type of rural municipality that can be incorporated by the Lieutenant Governor in Council under the authority of the Special Areas Act, which was enacted in 2000.[8][37] They were originally created in 1938 as a result of hardship brought upon a particular area in southeastern Alberta during the drought of the 1930s.[37]
Alberta has three special areas that had a cumulative population of 4,499 and an average population of 1,500 in the 2011 census.[2][3] The province's largest by population and land area is Special Area (SA) No. 2 with 2,025 and 9,342 km2 (3,607 sq mi) respectively. Alberta's smallest by population is SA No. 3 with 1,122, while its smallest by land area is SA No. 4 with 4,403 km2 (1,700 sq mi).[3] The last special area to form was SA No. 4, which incorporated on January 1, 1969 through the removal of certain lands from SA No. 3.[41] The three special areas are administered as a single unit by the Special Areas Board, and are home to 16 unincorporated communities recognized as hamlets by Alberta Municipal Affairs.[37][41]
List of rural municipalities
| Rural municipalities of Alberta | |||||||
|---|---|---|---|---|---|---|---|
| Name | Status[2] | Incorporation date (current status) [39][40][41] |
Population (2011)[3] |
Population (2006)[3] |
Change (%)[3] |
Land area (km²)[3] |
Population density (per km²)[3] |
| MD of Acadia No. 34 | Municipal district | December 9, 1913 | 495 | 545 | −9.2 | 1,076.26 | 0.5 |
| Athabasca County | Municipal district | January 1, 1947 | 7,662 | 7,572 | 1.2 | 6,122.75 | 1.3 |
| County of Barrhead No. 11 | Municipal district | January 1, 1955 | 6,096 | 5,845 | 4.3 | 2,404.70 | 2.5 |
| Beaver County | Municipal district | February 1, 1943 | 5,689 | 5,676 | 0.2 | 3,315.84 | 1.7 |
| Big Lakes County[lower-alpha 16] | Municipal district | January 1, 1995 | 4,194[14] | 3,995 | 5.0 | 11,965.83 | 0.3 |
| MD of Bighorn No. 8 | Municipal district | January 1, 1988 | 1,341 | 1,264 | 6.1 | 2,767.94 | 0.5 |
| Birch Hills County | Municipal district | January 1, 1995 | 1,582 | 1,470 | 7.6 | 2,856.69 | 0.6 |
| MD of Bonnyville No. 87[lower-alpha 16] | Municipal district | January 1, 1955 | 10,101[14] | 9,047 | 11.7 | 5,451.49 | 1.9 |
| Brazeau County | Municipal district | July 1, 1988 | 7,201 | 7,040 | 2.3 | 3,020.71 | 2.4 |
| Camrose County | Municipal district | January 1, 1944 | 7,721 | 7,150 | 8.0 | 3,320.61 | 2.3 |
| Cardston County | Municipal district | January 1, 1954 | 4,167 | 4,037 | 3.2 | 3,414.87 | 1.2 |
| Clear Hills County | Municipal district | January 1, 1995 | 2,801 | 2,714 | 3.2 | 15,115.03 | 0.2 |
| Clearwater County | Municipal district | January 1, 1985 | 12,278 | 11,826 | 3.8 | 18,691.78 | 0.7 |
| Cypress County | Municipal district | January 1, 1985 | 7,214 | 6,709 | 7.5 | 13,160.44 | 0.5 |
| MD of Fairview No. 136 | Municipal district | December 9, 1914 | 1,673 | 1,432 | 16.8 | 1,389.01 | 1.2 |
| Flagstaff County | Municipal district | January 1, 1944 | 3,591[lower-alpha 17] | 3,892 | −7.7 | 4,067.08 | 0.9 |
| MD of Foothills No. 31 | Municipal district | January 1, 1954 | 21,258 | 19,731 | 7.7 | 3,642.90 | 5.8 |
| County of Forty Mile No. 8 | Municipal district | January 1, 1954 | 3,336 | 3,414 | −2.3 | 7,229.68 | 0.5 |
| County of Grande Prairie No. 1 | Municipal district | December 21, 1943 | 20,347 | 17,929 | 13.5 | 5,862.74 | 3.5 |
| MD of Greenview No. 16 | Municipal district | January 1, 1994 | 5,299 | 5,464 | −3.0 | 32,989.05 | 0.2 |
| Improvement District No. 4 (Waterton) | Improvement district | January 1, 1944 | 88 | 160 | −45.0 | 480.58 | 0.2 |
| Improvement District No. 9 (Banff) | Improvement district | April 1, 1945 | 1,175 | 938 | 25.3 | 6,782.23 | 0.2 |
| Improvement District No. 12 (Jasper National Park) | Improvement district | April 1, 1945 | 34 | 24 | 41.7 | 10,181.58 | 0.0 |
| Improvement District No. 13 (Elk Island) | Improvement district | April 1, 1958 | 10 | 21 | −52.4 | 165.28 | 0.1 |
| Improvement District No. 24 (Wood Buffalo) | Improvement district | January 1, 1967 | 590 | 422 | 39.8 | 33,412.25 | 0.0 |
| Improvement District No. 25 (Willmore Wilderness) | Improvement district | January 2, 1994 | 0 | 0 | — | 4,604.97 | 0.0 |
| Improvement District No. 349 | Improvement district | January 1, 2012 | 0[44] | — | — | 5,804.56 | 0.0 |
| Kananaskis Improvement District | Improvement district | January 1, 1983 | 249 | 429 | −42.0 | 4,210.72 | 0.1 |
| Kneehill County | Municipal district | January 1, 1944 | 4,921 | 5,218 | −5.7 | 3,380.04 | 1.5 |
| Lac La Biche County[lower-alpha 16] | Municipal district | August 1, 2007 | 8,397[14] | 9,118 | −7.9 | 16,299.60 | 0.5 |
| Lac Ste. Anne County | Municipal district | January 1, 1944 | 10,260 | 9,880 | 3.8 | 2,845.61 | 3.6 |
| Lacombe County | Municipal district | January 1, 1944 | 10,312 | 10,394 | −0.8 | 2,766.65 | 3.7 |
| Lamont County | Municipal district | January 1, 1944 | 3,872 | 3,905 | −0.8 | 2,385.91 | 1.6 |
| Leduc County | Municipal district | January 1, 1944 | 13,524[28] | 13,135 | 3.1 | 2,607.56 | 5.2 |
| MD of Lesser Slave River No. 124 | Municipal district | January 1, 1995 | 2,929 | 2,820 | 3.9 | 10,075.88 | 0.3 |
| Lethbridge County | Municipal district | January 1, 1954 | 10,061 | 10,254 | −1.9 | 2,837.80 | 3.5 |
| County of Minburn No. 27 | Municipal district | January 30, 1942 | 3,383[lower-alpha 18] | 3,319 | 1.9 | 2,910.71 | 1.2 |
| Mountain View County | Municipal district | January 1, 1944 | 12,359 | 12,308 | 0.4 | 3,779.34 | 3.3 |
| County of Newell | Municipal district | January 1, 1953 | 6,786 | 6,852 | −1.0 | 5,904.72 | 1.1 |
| County of Northern Lights[lower-alpha 16] | Municipal district | January 1, 1995 | 3,555 | 3,556 | −0.0 | 19,027.69 | 0.2 |
| Northern Sunrise County[lower-alpha 16] | Municipal district | April 1, 1994 | 1,791[14] | 1,747 | 2.5 | 21,140.10 | 0.1 |
| MD of Opportunity No. 17 | Municipal district | August 1, 1995 | 3,074 | 2,847 | 8.0 | 29,140.78 | 0.1 |
| County of Paintearth No. 18 | Municipal district | January 1, 1944 | 2,029 | 2,126 | −4.6 | 3,287.24 | 0.6 |
| Parkland County | Municipal district | January 1, 1969 | 30,568 | 29,220 | 4.6 | 2,387.68 | 12.8 |
| MD of Peace No. 135 | Municipal district | December 11, 1916 | 1,446[28] | 1,487 | −9.6 | 850.88 | 1.6 |
| MD of Pincher Creek No. 9 | Municipal district | January 1, 1944 | 3,158 | 3,309 | −4.6 | 3,480.91 | 0.9 |
| Ponoka County | Municipal district | January 1, 1952 | 8,856 | 8,640 | 2.5 | 2,807.94 | 3.2 |
| MD of Provost No. 52 | Municipal district | March 1, 1943 | 2,288 | 2,547 | −10.2 | 3,625.2 | 0.6 |
| MD of Ranchland No. 66 | Municipal district | January 1, 1995 | 79 | 86 | −8.1 | 2,639.16 | 0.0 |
| Red Deer County | Municipal district | January 1, 1944 | 18,351 | 18,649 | −1.6 | 3,949.00 | 4.6 |
| Rocky View County | Municipal district | January 1, 1955 | 36,461 | 33,173 | 9.9 | 3,885.41 | 9.4 |
| Saddle Hills County | Municipal district | January 1, 1995 | 2,288 | 2,458 | −6.9 | 5,836.92 | 0.4 |
| Smoky Lake County[lower-alpha 16] | Municipal district | March 1, 1943 | 2,459[14] | 2,716 | −9.5 | 2,632.92 | 0.9 |
| MD of Smoky River No. 130 | Municipal district | January 1, 1952 | 2,126 | 2,442 | −12.9 | 2,842.59 | 0.7 |
| Special Area No. 2 | Special area | April 7, 1959 | 2,025 | 2,074 | −2.4 | 9,342.42 | 0.2 |
| Special Area No. 3 | Special area | April 7, 1959 | 1,122 | 1,266 | −11.4 | 6,623.96 | 0.2 |
| Special Area No. 4 | Special area | January 1, 1969 | 1,352 | 1,389 | −2.7 | 4,403.03 | 0.3 |
| MD of Spirit River No. 133 | Municipal district | December 11, 1916 | 713 | 662 | 7.7 | 684.14 | 1.0 |
| County of St. Paul No. 19 | Municipal district | January 30, 1942 | 5,831 | 5,925 | −1.6 | 3,296.72 | 1.8 |
| Starland County | Municipal district | February 1, 1943 | 2,057 | 2,371 | −13.2 | 2,557.7 | 0.8 |
| County of Stettler No. 6 | Municipal district | March 1, 1943 | 5,103[28] | 5,189 | −1.9 | 4,005.10 | 1.3 |
| Sturgeon County | Municipal district | January 1, 1955 | 19,578 | 18,566 | 5.5 | 2,088.55 | 9.4 |
| MD of Taber | Municipal district | January 1, 1954 | 6,851 | 6,275 | 9.2 | 4,203.79 | 1.6 |
| Thorhild County | Municipal district | January 1, 1955 | 3,417 | 3,547 | −3.7 | 2,000.05 | 1.7 |
| County of Two Hills No. 21 | Municipal district | January 1, 1944 | 3,160 | 2,918 | 8.3 | 2,631.33 | 1.2 |
| County of Vermilion River | Municipal district | January 1, 1944 | 7,905 | 7,462 | 5.9 | 5,518.18 | 1.4 |
| Vulcan County | Municipal district | January 1, 1951 | 3,875 | 3,718 | 4.2 | 5,429.50 | 0.7 |
| MD of Wainwright No. 61 | Municipal district | January 30, 1942 | 4,138 | 3,558 | 16.3 | 4,153.72 | 1.0 |
| County of Warner No. 5 | Municipal district | January 1, 1954 | 3,841 | 3,654 | 5.1 | 4,517.67 | 0.9 |
| Westlock County | Municipal district | February 1, 1943 | 7,644 | 6,910 | 10.6 | 3,170.71 | 2.4 |
| County of Wetaskiwin No. 10 | Municipal district | February 1, 1943 | 10,866 | 10,519 | 3.3 | 3,129.40 | 3.5 |
| Wheatland County | Municipal district | January 1, 1955 | 8,285 | 8,109 | 2.2 | 4,539.26 | 1.8 |
| MD of Willow Creek No. 26 | Municipal district | January 1, 1954 | 5,107 | 5,337 | −4.3 | 4,558.89 | 1.1 |
| Woodlands County | Municipal district | January 1, 1994 | 4,306 | 4,158 | 3.6 | 7,668.31 | 0.6 |
| Yellowhead County | Municipal district | January 1, 1994 | 10,469 | 10,045 | 4.2 | 22,296.26 | 0.5 |
| Total municipal districts[lower-alpha 16] | — | — | 452,426 | 437,881 | 3.3 | 397,642.92 | 1.1 |
| Total improvement districts | — | — | 2,146 | 1,994 | 7.6 | 65,642.17 | 0.0 |
| Total special areas | — | — | 4,499 | 4,729 | −4.9 | 20,369.41 | 0.2 |
| Total rural municipalities[lower-alpha 16] | — | — | 458,966 | 444,604 | 3.2 | 483,654.5 | 0.9 |
| Province of Alberta | — | — | 3,645,257 | 3,290,350 | 10.8 | 640,081.87 | 5.7 |
Metis settlements
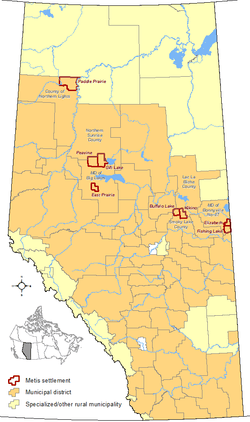
Metis settlements are unique local governments dedicated to Alberta's Metis people.[46][lower-alpha 19] The settlements were originally created in 1938 under the authority of the Metis Population Betterment Act with land and governance being transferred to the settlements in 1989.[46] Metis settlements are presently under the jurisdiction of the Metis Settlements Act, which was enacted in 2000.[9]
Alberta has eight Metis settlements.[2] Unlike the other types of municipalities, Metis settlements are not recognized as census subdivisions by Statistics Canada for federal census purposes.[13] Rather, Statistics Canada recognizes them as designated places embedded within six municipal districts.[38]
Alberta's eight Metis settlements had a cumulative population of 4,826 and an average population of 603 in the 2011 census.[47] The province's largest and smallest Metis settlements by population are Kikino and East Prairie with 964 and 366 respectively, while the largest and smallest by land area are Paddle Prairie and Elizabeth with 1,717 km2 (663 sq mi) and 250 km2 (97 sq mi) respectively.[47]
List of Metis settlements
| Metis settlements of Alberta | ||||||
|---|---|---|---|---|---|---|
| Name | Municipal district[34][38] | Population (2011)[47] |
Population (2006)[47] |
Change (%)[47] |
Land area (km²)[47] |
Population density (per km2)[47] |
| Buffalo Lake | Smoky Lake County | 492 | 248 | 98.4 | 336.97 | 1.5 |
| East Prairie | Big Lakes County | 366 | 352 | 4.0 | 333.87 | 1.1 |
| Elizabeth | MD of Bonnyville No. 87 | 654 | 663 | −1.4 | 250.21 | 2.6 |
| Fishing Lake | MD of Bonnyville No. 87 | 436 | 484 | −9.9 | 355.74 | 1.2 |
| Gift Lake[lower-alpha 20] | Big Lakes County Northern Sunrise County | 662 | 820 | −19.3 | 812.45 | 0.8 |
| Kikino[lower-alpha 21] | Smoky Lake County Lac La Biche County | 964 | 398 | 142.2 | 444.27 | 2.2 |
| Paddle Prairie | County of Northern Lights | 562 | 216 | 160.2 | 1,716.72 | 0.3 |
| Peavine | Big Lakes County | 690 | 822 | −16.1 | 817.13 | 0.8 |
| Total Metis settlements | — | 4,826 | 4,003 | 20.6 | 5,067.36 | 3.7 |
| Province of Alberta | — | 3,645,257 | 3,290,350 | 10.8 | 640,081.87 | 5.7 |
See also
Notes
- ↑ The remaining 1.4% of Alberta's population resides on Indian reserves or Indian settlements, which occupy the remaining 1.1% of the province's land mass.[3]
- ↑ Actual populations may not be 10 as Statistics Canada, to protect privacy, rounds population to the nearest 5 in the event a geographic area's actual population is less than 15.[21]
- ↑ Athabasca was formerly known as Athabasca Landing prior to August 4, 1913.[17]
- ↑ Bittern Lake was formerly known as Rosenroll prior to December 16, 1911.[24]
- ↑ Chestermere was formerly known as Chestermere Lake prior to March 1, 1993.[17]
- ↑ Delia was formerly known as Highland prior to December 9, 1915.[25]
- ↑ Drumheller originally incorporated as a city on April 3, 1930 but reverted from city status as a result of its amalgamation with the M.D. of Badlands No. 7 in 1998.[17]
- ↑ Fort Macleod was formerly known as Macleod prior to April 1, 1952.[17]
- ↑ Granum was formerly known as Leavings prior to March 31, 1908.[17]
- ↑ Hay Lakes was formerly known as Hay Lake prior to January 1, 1932.[18]
- ↑ The balance of Lloydminster is located within Saskatchewan. The 2011 and 2006 populations presented here do not include 9,772 and 8,118 in the Saskatchewan portion of Lloydminster respectively, while the land area also does not include 17.34 km2 (6.70 sq mi) in the Saskatchewan portion. The city's total populations in 2011 and 2006 were 27,804 and 24,028 respectively, while its total land area was 41.53 km2 (16.03 sq mi).[27]
- ↑ Peace River was formerly known as Peace River Crossing prior to May 22, 1916.[17]
- ↑ Ryley was also known as Equity in 1909.[29]
- ↑ Spring Lake was formerly known as Edmonton Beach prior to January 1, 1999.[30]
- ↑ St. Paul was originally named St. Paul de Metis.[31]
- 1 2 3 4 5 6 7 8 9 10 Statistics presented for six municipal districts (the Big Lakes County, the MD of Bonnyville No. 87, Lac La Biche County, the County of Northern Lights, Northern Sunrise County and Smoky Lake County) differ from statistics for their corresponding census subdivisions published by Statistics Canada to recognize that Alberta's eight Metis settlements, which are designated places located within these six municipal districts, are separate municipalities.[38] The statistics presented for total municipal districts and total rural municipalities therefore exclude the statistics associated with the eight Metis settlements.
- ↑ Figure includes the 119 residents of Galahad and the 228 residents of Strome, which both dissolved from village status on January 1, 2016 to become hamlets under the jurisdiction of the Flagstaff County.[42][43]
- ↑ Figure includes the 105 residents of Minburn which dissolved from village status on July 1, 2015 to become a hamlet under the jurisdiction of the County of Minburn No. 27.[45]
- ↑ The Metis are descendants of people of mixed First Nations and European heritage.
- ↑ Gift Lake comprises two parts. The majority is located within Big Lakes County, while the balance is located within Northern Sunrise County. The Big Lakes County portion had a population of 662 living on 811.30 km2 (313.24 sq mi) in 2011, while the Northern Sunrise County portion had a population of 0 living on 1.15 km2 (0.44 sq mi).[48]
- ↑ Kikino comprises two parts. The majority is located within Smoky Lake County, while the balance is located within Lac La Biche County. The Smoky Lake County portion had a population of 959 living on 442.92 km2 (171.01 sq mi) in 2011, while the Lac La Biche County portion had a population of 5 living on 1.35 km2 (0.52 sq mi).[49]
References
- ↑ "Population and dwelling counts, for Canada, provinces and territories, 2011 and 2006 censuses". Statistics Canada. Retrieved June 25, 2013.
- 1 2 3 4 5 6 7 8 9 10 11 12 13 14 15 "2016 Municipal Codes" (PDF). Alberta Municipal Affairs. January 12, 2016. pp. 1–5. Retrieved January 17, 2016.
- 1 2 3 4 5 6 7 8 9 10 11 12 13 14 15 16 17 18 19 20 21 22 23 24 25 26 27 28 29 30 31 32 33 34 35 36 37 38 39 "Population and dwelling counts, for Canada, provinces and territories, and census subdivisions (municipalities), 2011 and 2006 censuses (Alberta)". Statistics Canada. August 9, 2016. Retrieved November 5, 2016.
- ↑ "What Are Municipalities?". Alberta Municipal Affairs. Retrieved October 28, 2013.
- ↑ "The Provisions of Programs and Services Through Municipalities". Alberta Municipal Affairs. Retrieved October 28, 2013.
- 1 2 3 4 5 6 7 8 9 10 11 12 13 14 15 16 "Municipal Government Act, Revised Statutes of Alberta 2000, Chapter M–26 (Office Consolidation)" (PDF). Alberta Queen's Printer. June 17, 2013. pp. 30–31, 47, 64–66, 69, 306. Retrieved October 20, 2013.
- ↑ "Types Of Municipalities In Alberta". Alberta Municipal Affairs. Retrieved November 5, 2013.
- 1 2 3 "Special Areas Act, Revised Statutes of Alberta 2000, Chapter S–16 (Office Consolidation)" (PDF). Alberta Queen's Printer. May 27, 2013. Retrieved October 20, 2013.
- 1 2 3 "Metis Settlements Act, Revised Statutes of Alberta 2000, Chapter M–14 (Office Consolidation)" (PDF). Alberta Queen's Printer. June 17, 2013. Retrieved October 20, 2013.
- ↑ "Information Sheet: The Legislative Assembly of Alberta" (PDF). Legislative Assembly of Alberta. p. 2. Retrieved November 1, 2013.
- ↑ "About The Ministry of Municipal Affairs". Alberta Municipal Affairs. Retrieved October 20, 2013.
- 1 2 "2013 Municipal Affairs Population List" (PDF). Alberta Municipal Affairs. November 20, 2013. p. 9. ISBN 978-1-4601-1418-6. Retrieved December 6, 2013.
- 1 2 3 4 "Interim List of Changes to Municipal Boundaries, Status, and Names: From January 2, 2012 to January 1, 2013" (PDF). Statistics Canada. pp. 6–7. Retrieved October 20, 2013.
- 1 2 3 4 5 6 "2012 Municipal Affairs Population List" (PDF). Alberta Municipal Affairs. November 22, 2012. pp. 1–2, 10. Retrieved October 20, 2013.
- 1 2 "O.C. 499/2014". Government of Alberta. December 19, 2014. Retrieved January 1, 2015.
- 1 2 "Municipal Profiles: Summary Reports (Cities)" (PDF). Alberta Municipal Affairs. October 18, 2013. Retrieved October 20, 2013.
- 1 2 3 4 5 6 7 8 "Municipal Profiles: Summary Reports (Towns)" (PDF). Alberta Municipal Affairs. October 18, 2013. Retrieved October 20, 2013.
- 1 2 3 4 "Municipal Profiles: Summary Reports (Villages)" (PDF). Alberta Municipal Affairs. October 18, 2013. Retrieved October 20, 2013.
- ↑ Jack K. Masson with Edward C. LeSage (1994). Alberta's Local Governments: Politics and Democracy. The University of Alberta Press. p. 69. ISBN 0-88864-251-2.
- ↑ "Types of Municipalities in Alberta: Urban Municipal Governments". Alberta Municipal Affairs. Retrieved October 20, 2013.
- ↑ "Population and Dwelling Count Highlight Tables, 2011 Census – Notes (Adjustment of population counts)". Statistics Canada. January 30, 2013. Retrieved October 31, 2013.
- ↑ "Municipal Profiles: Summary Reports (Summer Villages)" (PDF). Alberta Municipal Affairs. October 18, 2013. Retrieved October 20, 2013.
- ↑ "Order in Council 461/2002". Government of Alberta. October 8, 2002. Retrieved October 31, 2013.
- ↑ "Order in Council 979/11" (PDF). Alberta Municipal Affairs. December 16, 1911. Retrieved July 26, 2010.
- ↑ "Change in Name of Village Municipality – Highland to Delia" (PDF). Alberta Municipal Affairs. December 9, 1915. Retrieved July 26, 2010.
- 1 2 "2006 Census corrections and updates". Statistics Canada. June 23, 2009. Retrieved June 1, 2013.
- ↑ "Census Profile: Lloydminster (Part), Alberta (Code 4810039) and Lloydminster (Part), Saskatchewan (Code 4717029) (table)". Statistics Canada. March 1, 2013. Retrieved November 3, 2013.
- 1 2 3 4 5 6 7 8 "Corrections and updates". Statistics Canada. December 30, 2015. Retrieved November 5, 2016.
- ↑ "The Village of Ryley – Equity". Village of Ryley. Retrieved April 13, 2010.
- ↑ "Order in Council 517/98". Alberta Municipal Affairs. December 9, 1998. Retrieved July 26, 2010.
- ↑ "Order in Council 518/12" (PDF). Government of Alberta. June 14, 1912. Retrieved November 3, 2013.
- ↑ "Types Of Municipalities In Alberta: Specialized Municipalities". Alberta Municipal Affairs. Retrieved October 28, 2013.
- 1 2 3 "Municipal Profiles (Specialized Municipalities)" (PDF). Alberta Municipal Affairs. December 27, 2013. Retrieved December 30, 2013.
- 1 2 3 4 5 "Specialized and Rural Municipalities and Their Communities" (PDF) (PDF). Alberta Municipal Affairs. August 30, 2013. Retrieved October 29, 2013.
- ↑ "Order in Council 817/94" (PDF). Province of Alberta. December 21, 1994. Retrieved October 29, 2013.
- ↑ "Order in Council 761/95" (PDF). Province of Alberta. December 6, 1995. Retrieved October 29, 2013.
- 1 2 3 4 5 6 7 8 9 "Types Of Municipalities In Alberta: Rural Municipal Governments". Alberta Municipal Affairs. October 28, 2013.
- 1 2 3 4 "Population and dwelling counts, for Canada, provinces and territories, census divisions, census subdivisions (municipalities) and designated places, 2011 and 2006 censuses". Statistics Canada. January 30, 2013. Retrieved November 4, 2013.
- 1 2 3 "Municipal Profiles: Summary Reports (Municipal Districts)" (PDF). Alberta Municipal Affairs. October 18, 2013. Retrieved October 29, 2013.
- 1 2 "Municipal Profiles: Summary Reports (Improvement Districts)" (PDF). Alberta Municipal Affairs. October 18, 2013. pp. PDF pages 1, 9, 17, 25, 33, 41, 48 and 56. Retrieved October 29, 2013.
- 1 2 3 "Municipal Profiles: Summary Reports (Special Areas Board)" (PDF). Alberta Municipal Affairs. October 18, 2013. p. 1. Retrieved October 29, 2013.
- ↑ "O.C. 259/2015". Government of Alberta. November 17, 2015. Retrieved November 19, 2015.
- ↑ "O.C. 260/2015". Government of Alberta. November 17, 2015. Retrieved November 19, 2015.
- ↑ "Interim List of Changes to Municipal Boundaries, Status, and Names From January 2, 2011 to January 1, 2012 (Table 1 – Changes to census subdivisions in alphabetical order by province and territory)" (XLSX). Statistics Canada. November 14, 2012. Retrieved June 6, 2013.
- ↑ "O.C. 152/2015". Government of Alberta. June 24, 2015. Retrieved June 30, 2015.
- 1 2 "Premier Redford celebrates Metis Settlements 75th anniversary". Alberta Government. August 15, 2013. Retrieved October 29, 2013.
- 1 2 3 4 5 6 7 "Population and dwelling counts, for Canada, provinces and territories, and designated places, 2011 and 2006 censuses (Alberta)". Statistics Canada. January 30, 2013. Retrieved October 29, 2013.
- ↑ "Census Profile: Gift Lake part A, Alberta (Code 480087) and Gift Lake part B, Alberta (Code 480274) (table)". Statistics Canada. March 1, 2013. Retrieved November 3, 2013.
- ↑ "Census Profile: Kikino part A, Alberta (Code 480116) and Kikino part B, Alberta (Code 480275) (table)". Statistics Canada. March 1, 2013. Retrieved November 3, 2013.
External links
- Alberta Association of Municipal Districts and Counties
- Alberta Municipal Affairs
- Alberta Urban Municipalities Association
- Association of Summer Villages of Alberta
- Metis Settlements General Council
| |||||||||||||||||||||||||||||||||