Northland (New Zealand electorate)
Northland is a New Zealand parliamentary electorate, returning one Member of Parliament to the House of Representatives of New Zealand. The electorate was established for the 1996 election. It was represented by National Party MP Mike Sabin until his resignation on 30 January 2015. This forced a by-election in March 2015 which was won by NZ First Party leader Winston Peters.
Population centres
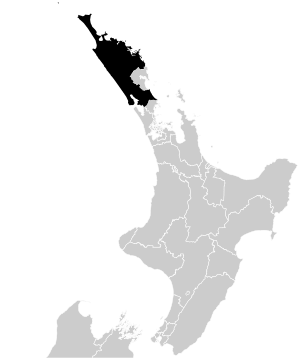
Northland is the northernmost general electorate of New Zealand. The electorate encompasses the entire Far North District and Kaipara District, and a small rural section of Whangarei District. At the 2008 election, the town of Wellsford became part of Northland due to heavy population growth in the Rodney seat.[1] No boundary adjustments were undertaken in the subsequent 2013/14 redistribution.[2]
Some of the Census Area Units that include a township (as well as potentially extensive rural-residential areas, such as the 36km2 Kerikeri CAU, which has a small town of Kerikeri at its centre with a usually resident population of approx. 3,000) in the electorate are: -(resident population in brackets)
- Taipa Bay-Mangonui (1,880)
- Kaitaia (5,670)
- Kerikeri (7,220)
- Paihia (1,960)
- Opua (860)
- Haruru Falls (870)
- Kawakawa (1,430)
- Moerewa (1,600)
- Kaikohe (4,400)
- Dargaville (4,920)
- Mangawhai Heads (1,086)
- Wellsford (1,970)
If settlements that are connected to a shared potable water and sewerage scheme are considered, the most populous urban settlement in the electorate runs from Opua to Haruru Falls, covering Waitangi and Paihia - which is home to 3,200 residents and as many visitors on any given day, and up to 12,000 during the peak of summer holiday season.
History
The Northland electorate was created ahead of the introduction of Mixed Member Proportional voting in 1996. It contains all of the Far North electorate (called Bay of Islands before 1993), and a large section of the old Hobson seat.
Former Bay of Islands and then Far North MP John Carter was elected MP for Northland in 1996, and was returned at every election until the 2008 election. Carter left Parliament in June 2011 to take up a post as New Zealand's High Commissioner to the Cook Islands. His departure did not result in a by-election, as the vacancy occurred within six months of the next general election.[3] In May 2011 Mike Sabin was selected as the National Party candidate to replace Carter.[4] Sabin had a majority of 11,362 and 9,300 votes in 2011 and 2014, respectively.[5][6] In December 2014 New Zealand media reported that Northland MP Mike Sabin was under investigation by police over an assault complaint. The reports were not confirmed by the New Zealand Police, the Prime Minister or Sabin himself.[7][8][9][10] Sabin resigned from parliament on 30 January 2015 with immediate effect "due to personal issues that were best dealt with outside Parliament."[11] The resignation forced a by-election in the Northland electorate.[12]
The electorate is one where National traditionally performs well; Labour has not won a general electorate north of Wellsford since a one-off victory in Whangarei in 1972. The upper North Island is also a place where New Zealand First has one of its strongest voter bases; in 1996, Ian Peters and Frank Grover of the Alliance beat Labour's candidate into fourth place and nine percent of the vote. Third parties do well in Northland - at the 1960 and 1963 elections, Social Credit candidate Vernon Cracknell came runner up in Hobson, before taking the seat with 48 percent of the vote in 1966. The area had previously been receptive to social credit theory - Harold Rushworth of the credit-influenced Country Party had held Bay of Islands for three terms, from 1928 to 1938.
Members of Parliament
Key
| National | NZ First | Alliance |
| Christian Heritage | Green | Labour |
| Election | Winner | |
|---|---|---|
| 1996 election | John Carter | |
| 1999 election | ||
| 2002 election | ||
| 2005 election | ||
| 2008 election | ||
| 2011 election | Mike Sabin | |
| 2014 election | ||
| 2015 by-election | Winston Peters | |
List MPs
Members of Parliament elected from party lists in elections where that person also unsuccessfully contested the Northland electorate. Unless otherwise stated, all MPs terms began and ended at general elections.
| Election | Winner | |
|---|---|---|
| 1996 election | Frank Grover1 | |
| 1999 election | Sue Bradford | |
| 2002 election | Jim Peters | |
| 2005 election | Shane Jones | |
| 2008 election | Shane Jones | |
| 2014 election | David Clendon | |
1 Grover left the Alliance in 1999 and joined the Christian Heritage Party.
Election results
2015 by-election
The following table shows final by-election results:[13]
| Northland by-election, 2015 | |||||
|---|---|---|---|---|---|
|
Notes: Green background denotes the winner of the by-election. | |||||
| Party | Candidate | Votes | % | ±% | |
| NZ First | Winston Peters | 16,089 | 54.45 | +54.45 | |
| National | Mark Osborne | 11,648 | 39.42 | −13.32 | |
| Labour | Willow-Jean Prime | 1,380 | 4.67 | −21.22 | |
| Focus | Joe Carr | 113 | 0.38 | −4.41 | |
| Legalise Cannabis | Maki Herbert | 94 | 0.32 | +0.32 | |
| ACT | Robin Grieve | 68 | 0.23 | −0.35 | |
| Mana | Reuben Porter | 60 | 0.20 | +0.20 | |
| Climate | Rob Painting | 39 | 0.13 | +0.13 | |
| Independent | Bruce Rogan | 24 | 0.08 | +0.08 | |
| Independent | Adrian Bonner | 17 | 0.06 | +0.06 | |
| Independent | Adam Holland | 16 | 0.05 | +0.05 | |
| Informal votes | 42 | 0.14 | −1.05 | ||
| Total Valid votes | 29,548 | ||||
| Turnout | 29,590 | 64.39 | −14.51 | ||
| Registered electors | 45,955 | ||||
| NZ First gain from National | Majority | 4,441 | 15.03 | ||
2014 election
| General election 2014: Northland[14] | |||||||||
|---|---|---|---|---|---|---|---|---|---|
|
Notes: Green background denotes the winner of the electorate vote.
| |||||||||
| Party | Candidate | Votes | % | ±% | Party Votes | % | ±% | ||
| National | |
18,269 | 52.74 | −4.81 | 17,412 | 48.97 | −1.17 | ||
| Labour | Willow-Jean Prime | 8,969 | 25.89 | +4.30 | 5,913 | 16.63 | −0.97 | ||
| Green | David Clendon | 3,639 | 10.51 | −1.59 | 3,855 | 10.84 | −0.94 | ||
| Focus | Ken Rintoul | 1,661 | 4.80 | +4.80 | 216 | 0.61 | +0.61 | ||
| Conservative | Melanie Taylor | 1,555 | 4.49 | −0.59 | 2,243 | 6.31 | +1.06 | ||
| ACT | Craig Nelson | 200 | 0.58 | −0.25 | 162 | 0.46 | −1.19 | ||
| Democrats | David Angus Wilson | 173 | 0.50 | +0.50 | 64 | 0.18 | +0.07 | ||
| Independent | Murray Robertson | 96 | 0.28 | +0.28 | |||||
| Money Free | Jordan Osmaston | 75 | 0.22 | +0.22 | |||||
| NZ First | 4,546 | 12.79 | +2.59 | ||||||
| Internet Mana | 601 | 1.69 | +0.40[lower-alpha 1] | ||||||
| Māori | 210 | 0.59 | −0.20 | ||||||
| Legalise Cannabis | 193 | 0.54 | −0.11 | ||||||
| United Future | 71 | 0.20 | −0.26 | ||||||
| Ban 1080 | 51 | 0.14 | +0.14 | ||||||
| Independent Coalition | 9 | 0.03 | +0.03 | ||||||
| Civilian | 7 | 0.02 | +0.02 | ||||||
| Informal votes | 419 | 154 | |||||||
| Total Valid votes | 34,637 | 35,553 | |||||||
| Turnout | 35,553 | 78.90 | +4.97 | ||||||
| National hold | Majority | 9,300 | 26.85 | −9.10 | |||||
2011 election
| General election 2011: Northland[5] | |||||||||
|---|---|---|---|---|---|---|---|---|---|
|
Notes: Green background denotes the winner of the electorate vote.
| |||||||||
| Party | Candidate | Votes | % | ±% | Party Votes | % | ±% | ||
| National | |
18,188 | 57.55 | -1.59 | 16,381 | 50.15 | -1.55 | ||
| Labour | Lynette Stewart | 6,826 | 21.60 | -7.64 | 5,748 | 17.60 | -7.44 | ||
| Green | Pauline Evans | 3,822 | 12.09 | +5.22 | 3,848 | 11.78 | +4.44 | ||
| Conservative | Melanie Taylor | 1,606 | 5.08 | +5.08 | 1,714 | 5.25 | +5.25 | ||
| Mana | Ngawai Herewini | 611 | 1.93 | +1.93 | 420 | 1.29 | +1.29 | ||
| Māori | Josephine Peita | 290 | 0.92 | +0.92 | 257 | 0.79 | -0.69 | ||
| ACT | Barry Brill | 261 | 0.83 | -0.85 | 536 | 1.64 | -2.57 | ||
| NZ First | 3,330 | 10.19 | +3.79 | ||||||
| Legalise Cannabis | 213 | 0.65 | +0.23 | ||||||
| United Future | 149 | 0.46 | -0.21 | ||||||
| Democrats | 35 | 0.11 | -0.03 | ||||||
| Libertarianz | 25 | 0.08 | +0.004 | ||||||
| Alliance | 9 | 0.03 | -0.05 | ||||||
| Informal votes | 972 | 308 | |||||||
| Total Valid votes | 31,604 | 32,665 | |||||||
| National hold | Majority | 11,362 | 35.95 | +6.05 | |||||
Electorate (as at 26 November 2011): 44,182[15]
2008 election
| General election 2008: Northland[16] | |||||||||
|---|---|---|---|---|---|---|---|---|---|
|
Notes: Green background denotes the winner of the electorate vote.
| |||||||||
| Party | Candidate | Votes | % | ±% | Party Votes | % | ±% | ||
| National | |
19,889 | 59.14 | 17,703 | 51.70 | ||||
| Labour | Shane Jones | 9,835 | 29.24 | 8,573 | 25.04 | ||||
| Green | Martin Leiding | 2,311 | 6.87 | 2,514 | 7.34 | ||||
| ACT | Alan (Smilie) Wood | 565 | 1.68 | 1,443 | 4.21 | ||||
| Kiwi | Mike Shaw | 381 | 1.13 | 216 | 0.63 | ||||
| Family Party | Melanie Taylor | 319 | 0.95 | 162 | 0.47 | ||||
| Democrats | David Wilson | 171 | 0.51 | 48 | 0.14 | ||||
| United Future | Phil Johnson | 162 | 0.48 | 228 | 0.67 | ||||
| NZ First | 2,194 | 6.41 | |||||||
| Māori | 507 | 1.48 | |||||||
| Progressive | 258 | 0.75 | |||||||
| Bill and Ben | 153 | 0.45 | |||||||
| Legalise Cannabis | 144 | 0.42 | |||||||
| Alliance | 28 | 0.08 | |||||||
| Libertarianz | 25 | 0.07 | |||||||
| Pacific | 17 | 0.05 | |||||||
| Workers Party | 16 | 0.05 | - | ||||||
| RAM | 6 | 0.02 | |||||||
| RONZ | 5 | 0.01 | |||||||
| Informal votes | 310 | 132 | |||||||
| Total Valid votes | 33,633 | 34,240 | |||||||
| National hold | Majority | 10,054 | |||||||
2005 election
| General election 2005: Northland[17] | |||||||||
|---|---|---|---|---|---|---|---|---|---|
|
Notes: Green background denotes the winner of the electorate vote.
| |||||||||
| Party | Candidate | Votes | % | ±% | Party Votes | % | ±% | ||
| National | |
16,577 | 54.12 | 14,182 | 45.69 | ||||
| Labour | Shane Jones | 7,302 | 23.84 | 9,384 | 30.23 | ||||
| Green | Sue Bradford | 2,764 | 9.02 | 2,000 | 6.44 | ||||
| NZ First | Jim Peters | 2,547 | 8.32 | 3,162 | 10.19 | ||||
| Māori | Malcolm Peri | 550 | 1.80 | 484 | 1.56 | ||||
| United Future | Phil Johnson | 315 | 1.03 | 618 | 1.99 | ||||
| Destiny | David Isaachsen | 278 | 0.91 | 196 | 0.63 | ||||
| ACT | Tom McClelland | 216 | 0.71 | 474 | 1.53 | ||||
| Libertarianz | Julian Pistorius | 51 | 0.17 | 27 | 0.09 | ||||
| Independent | Gray Phillips | 18 | 0.06 | ||||||
| Direct Democracy | Mel Whaanga | 10 | 0.03 | 5 | 0.02 | ||||
| Progressive | 272 | 0.88 | |||||||
| Legalise Cannabis | 94 | 0.30 | |||||||
| Democrats | 48 | 0.015 | |||||||
| Christian Heritage | 37 | 0.12 | |||||||
| Alliance | 27 | 0.09 | |||||||
| 99 MP | 11 | 0.04 | |||||||
| Family Rights | 6 | 0.02 | |||||||
| One NZ | 6 | 0.02 | |||||||
| RONZ | 6 | 0.02 | |||||||
| Informal votes | 233 | 133 | |||||||
| Total Valid votes | 30,628 | 31,039 | |||||||
| National hold | Majority | 9,275 | 30.28 | ||||||
Notes
- ↑ 2014 Internet Mana swing is relative to the votes for Mana in 2011; it shared a party list with Internet in the 2014 election.
References
- ↑ Report of the Representation Commission 2007 (PDF). Representation Commission. 14 September 2007. p. 8. ISBN 978-0-477-10414-2. Retrieved 4 October 2014.
- ↑ Report of the Representation Commission 2014 (PDF). Representation Commission. 4 April 2014. p. 8. ISBN 978-0-477-10414-2. Retrieved 4 October 2014.
- ↑ Trevett, Claire (8 June 2011). "MP pleads for laughter and leniency as he goes". New Zealand Herald. Retrieved 25 November 2011.
- ↑ McMillan, Malcolm (2 May 2011). "Anti-P man Mike Sabin takes safe National seat". stuff.co.nz. Retrieved 4 October 2014.
- 1 2 "Official Count Results -- Northland". Electoral Commission. 10 December 2011. Retrieved 4 October 2014.
- ↑ "Official Count Results -- Northland". Electoral Commission. 4 October 2014. Retrieved 4 October 2014.
- ↑ Bennett, Adam (22 December 2014). "Cloud over National MP's future". The New Zealand Herald. Retrieved 31 January 2015.
- ↑ Lomas, David (21 December 2014). "National MP Mike Sabin in police assault inquiry". stuff.co.nz. Retrieved 31 January 2015.
- ↑ Bennett, Adam (22 December 2014). "Sabin in the spotlight as assault allegation surfaces". The Northern Advocate. Retrieved 31 January 2015.
- ↑ "Police tight-lipped about assault allegation". Radio New Zealand. 21 December 2014. Retrieved 31 January 2015.
- ↑ "Mike Sabin announces resignation as Northland MP". Scoop. 30 January 2015. Retrieved 30 January 2015.
- ↑ "John Key says National did not ask Mike Sabin to quit after MP resigns 'due to personal issues'". The New Zealand Herald. 30 January 2015. Retrieved 31 January 2015.
- ↑ "Northland by-election official results". Electoral Commission. Retrieved 4 December 2016.
- ↑ "Official Count Results -- Northland". Electoral Commission. 21 December 2014. Retrieved 21 December 2014.
- ↑ "Enrolment statistics". Electoral Commission. 26 November 2011. Retrieved 27 November 2011.
- ↑ 2008 election results
- ↑ election result Northland 2005
External links
- Electorate Profile Parliamentary Library