Wigram (New Zealand electorate)
Wigram is a New Zealand parliamentary electorate, returning one Member of Parliament to the House of Representatives of New Zealand. The current MP for Wigram is Megan Woods of the Labour Party. She took over this position from Jim Anderton, who had held this position from 1996 until 2011.
Population centres
Through an amendment in the Electoral Act in 1965, the number of electorates in the South Island was fixed at 25, an increase of one since the 1962 electoral redistribution.[1] It was accepted that through the more rapid population growth in the North Island, the number of its electorates would continue to increase, and to keep proportionality, three new electorates were allowed for in the 1967 electoral redistribution for the next election.[2] In the North Island, five electorates were newly created and one electorate was reconstituted while three electorates were abolished.[3] In the South Island, three electorates were newly created (including Wigram) and one electorate was reconstituted while three electorates were abolished.[4] The overall effect of the required changes was highly disruptive to existing electorates, with all but three electorates having their boundaries altered.[5] These changes came into effect with the 1969 election.[2]
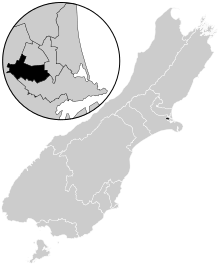
Wigram is based around south-western Christchurch. The main suburbs in the seat are Spreydon, Hillmorton, Riccarton, Hornby and Sockburn. Following the 2013/2014 boundary review, it lost the suburb of Somerfield and parts of Hoon Hay to Port Hills.[6] The electorate's name comes from the suburb of Wigram, and by extension the former Wigram Aerodrome, itself named after colonial businessman Sir Henry Wigram.
History
The electorate had previously existed from 1969 to 1978, when it was held by Mick Connelly for Labour.
Wigram was one of the original sixty-five Mixed Member Proportional (MMP) electorates created ahead of the 1996 election, when the number of South Island seats was reduced to sixteen. The formerly safe Labour seat of Sydenham lies at Wigram's core, and Labour's strong showing in the party vote in both 2002 and 2005, where the party won nearly half of all party votes cast, indicates that Wigram's political inclinations are left-leaning in nature. Its most well-known MP Jim Anderton was himself the Labour MP for Sydenham between 1984 and 1989, before he split from the party over its political directions and formed the NewLabour Party, which later merged into the Alliance; the Alliance disintegrated in 2002, but Anderton, by then the leader of the Progressive Party held off all challengers to easily hold the seat. In the 2011 election, the seat reverted to Labour candidate Megan Woods after his retirement, but the National Party comfortably won the party vote.[7] The chairman of the Canterbury-Westland branch of the National Party, Roger Bridge, stated in April 2014 that Woods had a low profile and the Wigram electorate was now "winnable".[8] Woods won re-election in the 2014 election with a more than a doubled majority.[9]
Members of Parliament
Unless otherwise stated, all MPs terms began and started at general elections.
Key Labour Alliance Progressive
| Election | Winner | |
|---|---|---|
| 1969 election | Mick Connelly | |
| 1972 election | ||
| 1975 election | ||
| (Electorate abolished 1978–1996) | ||
| 1996 election | Jim Anderton | |
| 1999 election | ||
| 2002 election | ||
| 2005 election | ||
| 2008 election | ||
| 2011 election | Megan Woods | |
| 2014 election | ||
Election results
2014 election
| General election 2014: Wigram[9] | |||||||||
|---|---|---|---|---|---|---|---|---|---|
|
Notes: Green background denotes the winner of the electorate vote.
| |||||||||
| Party | Candidate | Votes | % | ±% | Party Votes | % | ±% | ||
| Labour | |
14,519 | 48.95 | +3.84 | 8,764 | 28.67 | -1.94 | ||
| National | Karl Varley | 11,189 | 37.72 | -2.59 | 13,117 | 42.91 | -1.64 | ||
| Green | Richard Wesley | 2,324 | 7.83 | +0.07 | 3,919 | 12.82 | -0.34 | ||
| Conservative | Mark Peters | 847 | 2.86 | +0.34 | 1,102 | 3.61 | +1.24 | ||
| ACT | Shaun Grieve | 318 | 1.07 | +1.07 | 317 | 1.04 | +0.41 | ||
| Internet Mana | Lois McClintoch | 213 | 0.72 | +0.72 | 231 | 0.76 | +0.56 | ||
| Māori | Te Whe Phillips | 122 | 0.41 | +0.41 | 145 | 0.47 | +0.03 | ||
| Democrats | John Ring | 79 | 0.27 | +0.27 | 30 | 0.10 | +0.10 | ||
| Economic Euthenics | Tubby Hansen | 51 | 0.17 | +0.00 | |||||
| NZ First | 2,618 | 8.56 | +2.52 | ||||||
| Legalise Cannabis | 154 | 0.50 | -0.08 | ||||||
| United Future | 86 | 0.28 | -0.50 | ||||||
| Ban 1080 | 41 | 0.13 | +0.13 | ||||||
| Civilian | 31 | 0.10 | +0.10 | ||||||
| Independent Coalition | 7 | 0.02 | +0.02 | ||||||
| Focus | 5 | 0.02 | +0.02 | ||||||
| Informal votes | 401 | 136 | |||||||
| Total Valid votes | 29,662 | 30,567 | |||||||
| Labour hold | Majority | 3,330 | 11.23 | +6.43 | |||||
2011 election
| General election 2011: Wigram[7] | |||||||||
|---|---|---|---|---|---|---|---|---|---|
|
Notes: Green background denotes the winner of the electorate vote.
| |||||||||
| Party | Candidate | Votes | % | ±% | Party Votes | % | ±% | ||
| Labour | Megan Woods | 14,080 | 45.11 | +29.97 | 9,866 | 30.61 | -9.58 | ||
| National | Sam Collins | 12,580 | 40.31 | +9.65 | 14,357 | 44.55 | +6.63 | ||
| Green | Richard Wesley | 2,423 | 7.76 | +2.53 | 4,243 | 13.16 | +6.22 | ||
| Alliance | Kevin Campbell | 793 | 2.54 | +2.38 | 158 | 0.49 | +0.30 | ||
| Conservative | Mark Peters | 785 | 2.52 | +2.52 | 763 | 2.37 | +2.37 | ||
| Legalise Cannabis | Geoffrey McTague | 337 | 1.08 | +1.08 | 186 | 0.58 | +0.15 | ||
| United Future | Ian Gaskin | 159 | 0.51 | -1.03 | 251 | 0.78 | -0.23 | ||
| Economic Euthenics | Tubby Hansen | 53 | 0.17 | +0.09 | |||||
| NZ First | 1,948 | 6.04 | +3.05 | ||||||
| ACT | 202 | 0.63 | -1.23 | ||||||
| Māori | 141 | 0.44 | -0.13 | ||||||
| Mana | 66 | 0.20 | +0.20 | ||||||
| Libertarianz | 33 | 0.10 | +0.04 | ||||||
| Democrats | 16 | 0.05 | +0.01 | ||||||
| Informal votes | 775 | 305 | |||||||
| Total Valid votes | 31,210 | 32,230 | |||||||
| Labour gain from Progressive | Majority | 1,500 | 4.81 | +34.16 | |||||
Electorate (as at 26 November 2011): 45,427[10]
2008 election
| General election 2008: Wigram[11] | |||||||||
|---|---|---|---|---|---|---|---|---|---|
|
Notes: Green background denotes the winner of the electorate vote.
| |||||||||
| Party | Candidate | Votes | % | ±% | Party Votes | % | ±% | ||
| Progressive | |
15,320 | 44.50 | 2,010 | 5.73 | ||||
| National | Marc Alexander | 10,553 | 30.66 | 13,308 | 37.91 | ||||
| Labour | Erin Ebborn-Gillespie | 5,214 | 15.15 | 14,108 | 40.19 | ||||
| Green | Peter Taylor | 1,802 | 5.23 | 2,436 | 6.94 | ||||
| NZ First | Steve Campbell | 471 | 1.37 | 1,050 | 2.99 | ||||
| ACT | Matthew Gardiner | 355 | 1.03 | 653 | 1.86 | ||||
| Kiwi | Lindsay Cameron | 321 | 0.93 | 322 | 0.92 | ||||
| United Future | Vanessa Roberts | 219 | 0.64 | 355 | 1.01 | ||||
| Alliance | Tom Dowie | 55 | 0.16 | 68 | 0.19 | ||||
| Libertarianz | Ben Morgan | 55 | 0.16 | 22 | 0.06 | ||||
| Democrats | John Charles Ring | 32 | 0.09 | 13 | 0.04 | ||||
| Economic Euthenics | Michael Hansen | 28 | 0.08 | ||||||
| Bill and Ben | 251 | 0.72 | |||||||
| Māori | 198 | 0.56 | |||||||
| Legalise Cannabis | 151 | 0.43 | |||||||
| Family Party | 83 | 0.24 | |||||||
| Pacific | 51 | 0.15 | |||||||
| Workers Party | 17 | 0.05 | |||||||
| RONZ | 5 | 0.01 | |||||||
| RAM | 1 | 0.00 | |||||||
| Informal votes | 440 | 291 | |||||||
| Total Valid votes | 34,425 | 35,102 | |||||||
| Progressive hold | Majority | 4,767 | |||||||
2005 election
| General election 2005: Wigram[12] | |||||||||
|---|---|---|---|---|---|---|---|---|---|
|
Notes: Green background denotes the winner of the electorate vote.
| |||||||||
| Party | Candidate | Votes | % | ±% | Party Votes | % | ±% | ||
| Progressive | |
15,961 | 47.62 | +11.94 | 2,191 | 6.46 | |||
| National | Alison Lomax | 7,413 | 22.12 | +8.27 | 9,895 | 29.16 | |||
| Labour | Paul Chalmers | 6,408 | 19.12 | -6.45 | 16,271 | 47.95 | |||
| Green | Richard Suggate | 1,455 | 4.34 | 1,967 | 5.80 | ||||
| United Future | Vanessa Roberts | 988 | 2.95 | 1,313 | 3.87 | ||||
| NZ First | Brian Roswell | 912 | 2.72 | 1,577 | 4.65 | ||||
| ACT | Tetauru Emile | 203 | 0.61 | 255 | 0.75 | ||||
| Anti-Capitalist Alliance | Sam Kingi | 69 | 0.21 | ||||||
| Alliance | Tom Dowie | 61 | 0.21 | 55 | 0.16 | ||||
| Economic Euthenics | Michael Hansen | 29 | 0.09 | ||||||
| Direct Democracy | Anton Foljambe | 20 | 0.06 | 5 | 0.01 | ||||
| Destiny | 112 | 0.33 | |||||||
| Māori | 90 | 0.27 | |||||||
| Legalise Cannabis | 89 | 0.26 | |||||||
| Christian Heritage | 52 | 0.15 | |||||||
| Libertarianz | 22 | 0.06 | |||||||
| Democrats | 15 | 0.04 | |||||||
| RONZ | 8 | 0.02 | |||||||
| Family Rights | 6 | 0.02 | |||||||
| One NZ | 4 | 0.01 | |||||||
| 99 MP | 3 | 0.01 | |||||||
| Informal votes | 716 | 728 | |||||||
| Total Valid votes | 33,519 | 33,930 | |||||||
| Progressive hold | Majority | 8,548 | 25.50 | +15.39 | |||||
Notes
- ↑ McRobie 1989, pp. 108, 111, 112.
- 1 2 McRobie 1989, p. 111.
- ↑ McRobie 1989, pp. 107, 111.
- ↑ McRobie 1989, pp. 108, 112.
- ↑ McRobie 1989, pp. 111f.
- ↑ Report of the Representation Commission 2014 (PDF). Representation Commission. 4 April 2014. p. 10. ISBN 978-0-477-10414-2. Retrieved 26 September 2014.
- 1 2 "Official Count Results -- Wigram". Electoral Commission. 10 December 2011. Retrieved 11 September 2014.
- ↑ Conway, Glenn (26 April 2014). "National sets sights on Wigram". The Press. p. A16. Retrieved 18 October 2014.
- 1 2 "Official Count Results -- Wigram". Electoral Commission. 4 October 2014. Retrieved 4 October 2014.
- ↑ "Enrolment statistics". Electoral Commission. 26 November 2011. Retrieved 18 December 2011.
- ↑ 2008 election results
- ↑ 2005 election results
References
- McRobie, Alan (1989). Electoral Atlas of New Zealand. Wellington: GP Books. ISBN 0-477-01384-8.
- Wilson, James Oakley (1985) [First published in 1913]. New Zealand Parliamentary Record, 1840–1984 (4th ed.). Wellington: V.R. Ward, Govt. Printer. OCLC 154283103.
External links
- Electorate Profile Parliamentary Library